Download
1 / 2

E N D
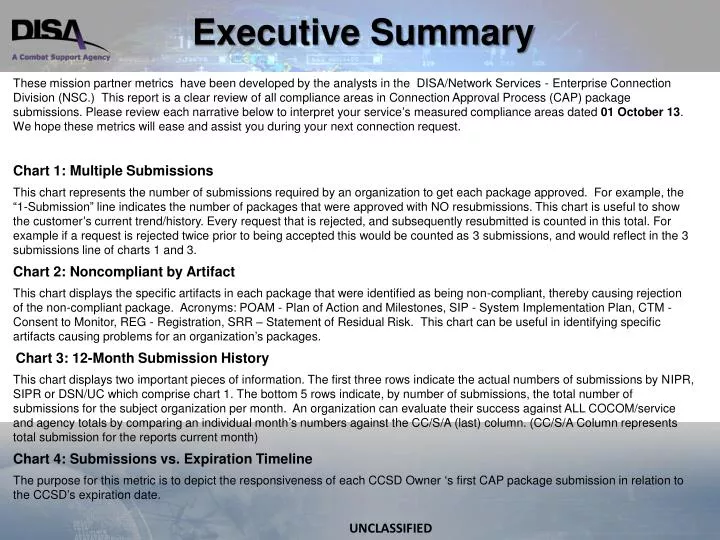
Executive Summary These mission partner metrics have been developed by the analysts in the DISA/Network Services - Enterprise Connection Division (NSC.) This report is a clear review of all compliance areas in Connection Approval Process (CAP) package submissions. Please review each narrative below to interpret your service’s measured compliance areas dated 01 October 13. We hope these metrics will ease and assist you during your next connection request. Chart 1: Multiple Submissions This chart represents the number of submissions required by an organization to get each package approved. For example, the “1-Submission” line indicates the number of packages that were approved with NO resubmissions. This chart is useful to show the customer’s current trend/history. Every request that is rejected, and subsequently resubmitted is counted in this total. For example if a request is rejected twice prior to being accepted this would be counted as 3 submissions, and would reflect in the 3 submissions line of charts 1 and 3. Chart 2: Noncompliant by Artifact This chart displays the specific artifacts in each package that were identified as being non-compliant, thereby causing rejection of the non-compliant package. Acronyms: POAM - Plan of Action and Milestones, SIP - System Implementation Plan, CTM - Consent to Monitor, REG - Registration, SRR – Statement of Residual Risk. This chart can be useful in identifying specific artifacts causing problems for an organization’s packages. Chart 3: 12-Month Submission History This chart displays two important pieces of information. The first three rows indicate the actual numbers of submissions by NIPR, SIPR or DSN/UC which comprise chart 1. The bottom 5 rows indicate, by number of submissions, the total number of submissions for the subject organization per month. An organization can evaluate their success against ALL COCOM/service and agency totals by comparing an individual month’s numbers against the CC/S/A (last) column. (CC/S/A Column represents total submission for the reports current month) Chart 4: Submissions vs. Expiration Timeline The purpose for this metric is to depict the responsiveness of each CCSD Owner ‘s first CAP package submission in relation to the CCSD’s expiration date.
All Submissions Summary (September 2013) Data as of 1 Oct 13