Download
1 / 16
160 likes | 179 Vues
Improving First Pass Denial Payment Rate. Discussion Topics. Cost of denied claims First Pass Denial rate versus traditional Denial Rate calculations Critical denial points in billing process Improving First Pass Denial rate Denial reporting Appeal processing and tracking.

E N D
Discussion Topics • Cost of denied claims • First Pass Denial rate versus traditional Denial Rate calculations • Critical denial points in billing process • Improving First Pass Denial rate • Denial reporting • Appeal processing and tracking
Payment turnaround times • If you bill correctly, they will pay. • If you bill correctly, they will pay most claims in 15 days. • If you bill most of your claims correctly, keep your unbilled to less than 7 days, GDRO in the 30 is easy!
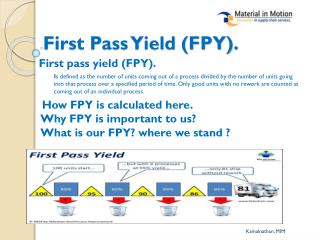
First Pass Denial rate will tell you what percent of claims are NOT getting billed out correctly. How important is FPD Rate?
Cost of unnecessary denials Cost to rework a claim due to denial = $25 Denial rates average 10-40% of claims 20,000 claims x 20% FPDR = 4,000 denials 4000 x $25 per denial = $100,000/month 1500 denials worked per FTE per month
Calculating Denial Rates How are denial rates reported? • Only denials that result in write off • Anything requiring rework • Service line versus total claim denial • Charges as a percent of revenue • Volume of denials being reworked by staff • By root cause or responsible area
Critical Denial Points • Edits (before claim leaves) • Registration edits • Coding edits • Patient Accounting system edits • Billing system/clearinghouse edits • Denials (after claim leaves) • 277/999 Payer electronic denials • Return to Provider denials (Medicare) • Remit denials
Change Denials into Edits • Start with Remit Denials since they delay payment turnaround the longest • Add RTP and 277 Denials to process • When changing Denials to Edits, shoot for the earliest possible point in the timeline (Registration/Coding) • Prioritize issues by dollar and volume
Denials Management • Track all denials by payer • Use system reports – Zero pay posting with reason codes • Select highest volume and highest dollar denial reasons each month to focus on reducing or eliminating • Add required registration fields, coding, prior authorization and billing edits or system holds to prevent claims from billing with incorrect data.
Denial Categories • Additional info requested - Patient • Additional info requested - Provider • Additional info requested • Authorization/Pre-Cert • Benefits Exhausted • Billing Related - Edit Review needed • Other Facility Overlap • Coding • Duplicate/Overlap • Eligibility/Coverage • Exceeds Frequency • Medical Necessity • Timely Filing • COB Issue • Provider Enrollment • Other