Download
1 / 30
300 likes | 524 Vues
Lightning data assimilation in the Rapid Refresh and evaluation of lightning diagnostics from HRRR runs. Steve Weygandt, Ming Hu, Curtis Alexander, Stan Benjamin, Eugene McCaul 1 NOAA ESRL, Global Systems Division, Assimilation and Modeling Branch 1 USRA, Huntsville, AL.

E N D
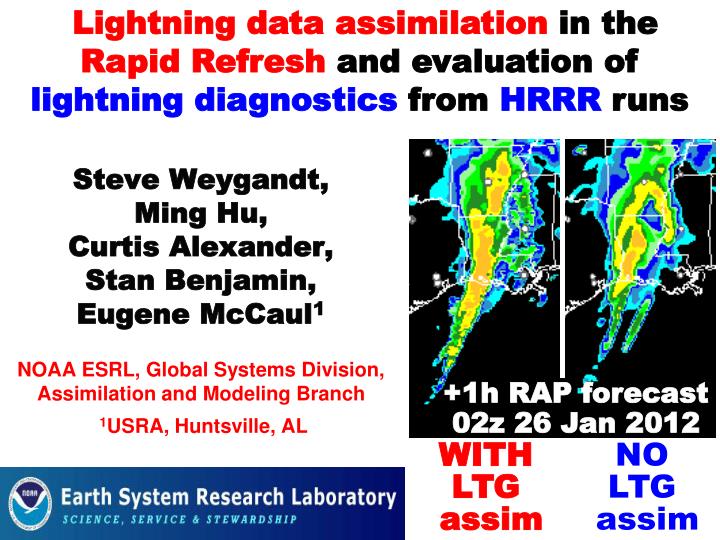
Lightning data assimilation in the Rapid Refresh and evaluation of lightning diagnostics from HRRR runs Steve Weygandt, Ming Hu,Curtis Alexander, Stan Benjamin, Eugene McCaul1NOAA ESRL, Global Systems Division,Assimilation and Modeling Branch1USRA, Huntsville, AL +1h RAP forecast 02z 26 Jan 2012 WITH LTG assim NO LTG assim
Rapid Refresh and HRRR NOAA hourly updated models NCEP RUC Rapid Refresh (01 May 2012) — Advanced community codes (ARW and GSI) — Retain key features from RUC analysis / model system (hourly cycle, radar DFI assimilation, cloud analysis) — RAP guidance for aviation, severe weather, energy applications Rapid Refresh-13 Rapid Refresh v2 GSD RUC-13 — Many improvements, target NCEP implement early 2014 GSD HRRR-3 HRRR – Runs as nest within RAP v2
RAP: Data assimilation engine for HRRR RAP Hourly cycling model Data Assimilation cycle Observations HRRR
Rapid RefreshHourly Update Cycle Partial cycle atmospheric fields – introduce GFS information 2x/day Fully cycle all land-sfc fields 1-hr fcst 1-hr fcst 1-hr fcst Back- ground Fields Analysis Fields 3DVAR 3DVAR Obs Obs Time (UTC) 11 12 13
Radar reflectivity assimilation Digital filter-based reflectivity assimilation initializes ongoing precipitation regions -20 min -10 min Initial +10 min + 20 min Backwards integration, no physics Forward integration,full physics with radar-based latent heating Initial fields with improved balance, storm-scale circulation RUC / RAP HRRR model forecast + RUC/RAP Convection suppression
Rapid Refresh (GSI + ARW) reflectivity assimilation example Upper-level Divergence Low-level Convergence NSSL radar reflectivity (dBZ) K=17 U-comp. diff (radar - norad) K=4 U-comp. diff (radar - norad) 14z 22 Oct 2008 Z = 3 km
Assimilation of lightning data • Objectives for different model resolutions • Parameterized convection (13-km RAP) • - storm detection in radar coverage voids • Explicit convection resolving (~3-km) • Very high-resolution (1-km and less) • - Specification of sub-storm-scale features • - Fusion of dual-pol radar data and total lightning mapper data to specify detailed microphysics • Methods • Use as proxy reflectivity, specify latent heat • Variational / ensemble methods
RAP assimilation of lightning data • Map lightning density to proxy reflectivity • -- sum ground flashes per grid-box • over 40 min period (-30 +10 min) • REFLmax = min [ 40, 15 + (2.5)(LTG)] • Sin distribution in vertical OLD specified relationship: NEW seasonally averaged empirical relationships: LTG and REFLmax REFLmaxand vertical REFL profile
Lightning Flash Rate max reflectivity NEW Seasonally dependent empirical Summer OLD specification in RUC Winter
SUMMER Reflectivity profile as a function of column maximum reflectivity Max dbz 30-35 Max dbz 40-45 Max dbz 35-40 Max dbz 45-50
WINTER Reflectivity profile as a function of column maximum reflectivity Max dbz 30-35 Max dbz 40-45 Max dbz 35-40 Max dbz 45-50
AVERAGE Reflectivity profile as a function of column maximum reflectivity Max dbz 30 - 35 Max dbz 40 - 55 Summer Summer 40 dBz 30 dBz Winter Winter Max dbz 35 - 40 Max dbz 45 - 50 Summer Summer 36 dBz 44 dBz Winter Winter
Applications lightning DA technique Can apply technique to lightning data and satellite-based indicators of convective initiation GLD-360 lightning data -- good long-range coverage Especially helpful for oceanic convection SATCAST cloud top cooling rate data -- good Convective Initiation (CI) indicator Avoiding model delay in storm development SATCAST work by Tracy Smith using data provided by John Mecikalski proxy flash rate = - 2 x cloud-top cooling rate (K/15 min)
Sat obs Radar coverage Rapid Refresh oceanic lightning assimilation example 24 Apr 2012 Observed reflectivity 16z No radar echo Latent heating-based temper-ature tendency Lightning flash rate No radar coverage 16z
Sat obs No radar echo Rapid Refresh oceanic lightning assimilation example 24 Apr 2012 No radar coverage Observed reflectivity 16z 16z 17z 17z 16z +1h GSD RAP forecasts LTG DA slight impact on RAP forecast storm clusters with LTG NO LTG
Dev 19z + 2h fcst Prim 19z + 2h fcst NO LTG assim WITH LTG assim Radar 1915z LTG ~ 11z LTG 21z 9 Jan
Assimilation of “satcast” cloud-top cooling rate CI-indicator data Cloud-top cooling rate helpful for initializing developing convection in GSD RAP retro tests 5 July 2012 18z 18z 5 July 2012 SATCAST cooling rate (K / 15 min) IR image 17z
18z+1h 19z WITH satcast assim Obs Reflect Assimilation of “Satcast” cooling rates provides more realistic short-range forecast of convective initiation and development 18z+1h NO satcast assim
18z+2h 20z WITH satcast assim Obs Reflect Assimilation of “Satcast” cooling rates provides more realistic short-range forecast of convective initiation and development 18z+2h NO satcast assim
Experimental HRRR lightning forecast guidance McCaul algorithm LTG1 Graupel flux a -15 C (cores) LTG2 Vertical integrated ice (anvils) LTG3 0.95 LTG1* + 0.05 LTG2* 2011 version: scale core by anvil 2012 version: scale anvil by core
Components of combined lightning threat (LTG3) (2011 version) 01z LTG1 LTG3 LTG2 Flases / km^2 / 5min
HRRR Combined lightning threat (LTG3) vs. radar and NALMA (North Alabama Lightning Map- ping Array) 23z HRRR LTG3 Obs radar NALMA lightning 19z + 4h
HRRR Combined lightning threat (LTG3) vs. radar and NALMA (North Alabama Lightning Map- ping Array) 00z HRRR LTG3 Obs radar NALMA lightning 19z + 5h
HRRR Combined lightning threat (LTG3) vs. radar and NALMA (North Alabama Lightning Map- ping Array) 01z HRRR LTG3 Obs radar NALMA lightning 19z + 6h
Lightning threat components (2012) 18z+3h Forecast 10 Jan 2013 Refl. LTG2 LTG1 LTG3 Flases / km^2 / 5min 1800z
Lightning threat components (2012) 18z+6h Forecast 10 Jan 2013 Refl. LTG2 LTG1 LTG3 Flases / km^2 / 5min 1800z
Lightning threat components (2012) 18z+9h Forecast 10 Jan 2013 Refl. LTG2 LTG1 LTG3 Flases / km^2 / 5min 1800z
Lightning threat components (2012) 18z+12h Forecast 10 Jan 2013 Refl. LTG2 LTG1 LTG3 Flases / km^2 / 5min 1800z
Summary • Preliminary evaluation of impact from assimilation of two novel convection indicators: • GLD-360 lightning data • -- good long-range coverage • Helpful for oceanic convection • Satcast cloud top cooling rate data • -- good CI • Avoid model delay in storm development • Preliminary look at lightning parameters • from HRRR 3-km forecasts • Qualitative assessment ongoing Plan HRRR runs from RAP w/ and w/o LTG, satcast