Download

1 / 25
250 likes | 257 Vues
UNIFIT 2019 The Art of Peak Fit for XPS, XAS, AES and RAMAN Spectroscopy. 1. Loading of Batch-Files. - Number of characters of the file-batch parameters variable from 1 to 5. - Files has to be the same name but a special extension in the name.

E N D
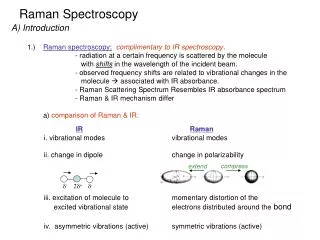
UNIFIT 2019The Art of Peak FitforXPS, XAS, AES andRAMAN Spectroscopy
1. Loading of Batch-Files • - Number of characters of the file-batch parameters variable from 1 to 5. • - Files has to be the same name but a special extension in the name. • - Example. Test_001.txt, Test_002.txt, Test_003.txt, Test_005.txt- The region batch names are the file extensions (S2p_001, S2p_002…) • File types: • XPS PHI SPE-Format • RAMAN WN increasing • RAMAN WN decreasing • XPS VAMAS-Format • XPS Scienta txt-Format (Sum of Slices)
2. Improved Resolution of XY-3D Plots - The number of plotted points of theXY-3D plots can be stepwise increased.- The X-axis and Y-axis can be changed separately.- In all cases the factor of the increasing of points is two. - The intensities of the additional point are calculated using a linear interpolation
3. Additional Option for the 100%-Calculation in the Quantification Table At-% calculation related to all peaks (normally). At-% calculation related to the lines with the same batch parameter.
4. Removing of Special Background Functions 1. No separate limits of the background calculation. 2. Function CONTINOUE removed. 5. Additional Option (Annotation of Selected Windows) of the ‘Title Annotation’
6. Definition of the ‘Number of Iterations’ During the Batch Processing by the User Setting of ‘Preferences – Batch Processing – Input Number of Iterations’ The number of cycles and iterations for the batch processing can be defined. The settings are saved in the file ‘presetting.set’ 7. Displaying of the Correct Measurement Data-File Names of Spectra Loaded Using Batch-File Loading Now the measurement data-file names have also the correct name of the files after batch-file loading. A separate new measurement-file names field was implemented into the software. In former versions all spectral regions had the same measurement-file name of the first loaded file.
8. Saving and Loading of Processing Steps and Design Features of a Selected Set of Regions 1. No saving of formatted spectrum titles and annotations. 2. No saving of interpolation procedure.3. No saving of charge correction. 4. For the using of the saved processing steps the names of the regions (processing-step name and region name) are compared. Loaded Regions Saved Processing Steps 1. Survey_01 Survey:2. C1s_01 - Annotation3. O 1s_01 O1s: 4. S2p_01 - Reduction5. Survey_02 - Satellite Subtraction6. C1s_02 - Fittable Background7. O1s_02 - Peak Fit, Sum, Relative8. S2p_02 C1s: - Reduction - Satellite Subtraction - Fittable Background - Peak Fit, Sum, Relative S2p; - Background Subtraction
9. Additional Manual Setting of the Plot of Spectra For dots, crosses, circles, squares, rectangles (standard and 3D windows)1. Automatic 2. All3. Every 2nd, 3rd, 4th
10. Manually Hidden Windows also Saved in UNIFIT Projects 11. Automatic Spike Correction of all Standard Windows • Spike correction is made using a modified Laplace method. • For the identification of the spikes a threshold multiplier is defined by the user (5 - 100). • The maximal number of spikes has to be defined (in %) (5...30). • After a spike correction the loading of original data during the batch processing is deactivated. The spectra modified by the Laplace Operator can be displayed.
11. Automatic spike correction… i = number of the measuring point (channel), j = number of the spectrumn = number of measuring points in the spectrum, m = number of recorded spectra.
11. Automatic Spike Correction, Step 1 and 2 • Definition of the threshold multiplier T for the identification of spikes (typically 20) anddefinition of the largest number (in %) of spikes n’. • Generation of the spectra modified using the Laplace Operator:Case a)i > 1, i < n, j > 1, j < mCase b) i > 1, i < n, j = 1Case c) i > 1, i < n, j = mCase d) i = 1, j > 1, j < mCase e) i = n, j > 1, j < mCase f) i = 1, j = 1Case g) i = 1, j = mCase h) i = n, j = 1Case i) i = n, j = m
11. Automatic Spike Correction, Step 3 • Calculation of the reference-average value A(j) for comparison with the defined threshold T⸳A(j). All spectra have the same number of measurement points n andn’ = n/20 (5% of the measured points, definition by users), n’ ≥ 5. a) Calculation of the matrix of P(k,j) of the positions of the maxima of theL(i,j) functions (i = 1...n, j = 1...m, k = 1...n’).b) Calculation of the matrix Q(k,j) of the positions of the minima of theL(i,j) functions (i = 1...n, j = 1...m, k = 1...n’).c) Estimation of the number of the negative values nneg(j) with exception of the values of P(k,j) and Q(k,j) (i = 1...n, j = 1...m, k = 1...n’): d) Estimation of the number of channels nave(j) for the calculation of A(j):e) Calculation of A(j) with exception of the channels P(k,j), Q(k,j) and the negative values L(i,j) < 0, (i = 1...n, j = 1...m, k = 1...n’):
11. Automatic Spike Correction, Step 4 • Estimation of the positions of spikes P(k,j) > 0 of every spectrum with the channels P(k,j) (Maximum number of spikes into every spectrum: n’). • All define a spike position.
11. Automatic Spike Correction, Step 5 5. Elimination of the spikes.
11. Automatic Spike Correction, Step 5 • a) If the channel iS of the spectrum j is a spike and therefore an element of the vector j of the matrix P’(k,j)then the intensities of the channels (if available)I(iS,j) - 2, I(iS,j) - 1, I(iS,j), I(iS,j) + 1and I(iS,j) + 2 • are changed. b) The correction is carried out from I(1,1), I(2,1) ... I(n,1), I(1,2),...,I(n,m). The intensities I’(i,j) are the corrected intensities and form the new spectra. c) Case a, e i > 1, j > 1, j < m, i - 2, i - 1, i, i + 1or i + 2 is element of P’(k,j) (k = 1...n’) If the channels i, i – 1 of the spectrum j + 1 are not elements of P’(k,j + 1) • If the channels i, i – 1 of the spectrum j + 1 are elements of P’(k,j + 1)
11. Automatic Spike Correction, Step 5 • c) Case b) i > 1, j = 1, i - 2, i - 1, i, i + 1or i + 2 is element of P’(k,1) (k = 1...n’) If the channels i,i – 1 of the spectrum j + 1 are not elements of P’(k,2) If the channels i, i - 1 of the spectrum j + 1 are elements of P’(k,2) Case c) i > 1, j = m, i - 2, i - 1, i, i + 1or i + 2 is element of P’(kim) (k = 1...n’) Case d) i = 1, j > 1, j < m,i - 2, i - 1, i, i + 1or i + 2 is element of P’(k,j) ( k= 1...n’) If the channel i of the spectrum j + 1 is not elements of P’(k,j + 1) If the channels i of the spectrum j + 1 are elements of P’(k,j + 1)
11. Automatic Spike Correction, Step 5 • c) Case f) i = 1, j = 1, i, i + 1or i + 2 is element of P’(ki,1) (k = 1...n’ ) If the channel 1 of the spectrum 2 is not elements of P’(k,2) If the channel 1 of the spectrum 2 is elements of P’(k,2) (no correction) Case g) i = 1, j = m, i, i + 1or i + 2 is element of P’(ki,m) (k = 1...n’ ) Case h) i =n, j = 1, i - 2, i – 1 or i is element of P’(k,1) (k = 1...n’ ) Case i) i =n, j = m, i - 2, i – 1 or i is element of P’(kim) (k = 1...n’ )The Channels i - 2, i - 1, i, i + 1and i + 2 of the spectrum j are not elements of P’(k,j) (k = 1...n’ )→no spikes
12. Mögliche Erweiterungen für Unifit 2020 • Parameterplots anfitten • Manuelle Auswahl der Darstellung bei Punkten, Strichen, … auch bei 3D-Darstellungen • Nutzerdefinition der maximalen Spikes (Prozent) im Spektrum • Polynom-Untergrund in Abhängigkeit der Energie berechnen • Automatische Quantifizierung aus Übersichtsspektren • Überlagerungen von Farbplots • Automatische XMCD-Auswertung einfügen • Beim Einladen von Spektren die Darstellung optional:a) in einzelnen Fenstern oderb) 3D-Darstellungen wählbar machen • Berechnung der IMFP direkt im Programm ermöglichen (Datenbanken für alle nötigen Größen erstellen) • Berechnung von Sigmawerten bei unterschiedlicher Anregungsenergie einbauen. • Direktausdruck auch als Bilddatei speicherbar. • Anzeigen eines Spektrum durch anklicken im XY-3D-Plot • Komponentenlinien unterschiedlich einfärben, wenn Komponentenflächen nicht gezeichnet werden. • Fluoreszenskorrektur bei RAMAN-Daten. • GIF-Files als Video exportieren.