Download
1 / 19
200 likes | 343 Vues
Functions, Tables, and Graphs. 4-2. Tables and Graphs. Course 2.

E N D
4-2 Tables and Graphs Course 2 In the wild, giant anteaters nurse their young. At Houston Zoo, baby giant anteaters are bottle-fed. By the time a baby is 3 months old, it drinks about 0.5 L of formula each day. The table shows the amount of formula needed to feed one baby giant anteater over several days.
4-2 Tables and Graphs Course 2 Check It Out: Example 1 Write the ordered pairs from the table. The ordered pairs are (3, -4), (2, -8), (8, 3), and (-1, 0).
4-2 Tables and Graphs 5 y 4 3 2 1 0 x 2 –1 –4 –2 1 –3 3 5 4 –5 –1 –2 –3 –4 –5 Course 2 Additional Example 2: Graphing Ordered Pairs from a Table of Values Write and graph the ordered pairs from the table. • (1, 4) • (3, 2) (–5, 0) • (–1, –2)• The ordered pairs are (1, 4), (-1, -2), (3, 2), and (-5, 0). Plot the points on a coordinate plane.
4-2 Tables and Graphs Course 2 Check It Out: Example 3 Graph the data in the table showing the number of days and its cost. What appears to be the relationship between the number of days and the cost shown in the table below? Write the ordered pairs from the table.
4-2 Tables and Graphs Course 2 Check It Out: Example 3 Continued The ordered pairs are (3, 3.75), (4, 5.00), (5, 6.25), and (6, 7.50). Now plot the points on a coordinate plane. Label the axes. Cost ($) The graph shows that the cost is the number of days multiplied by 1.25. Number of Days
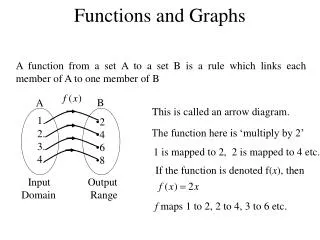
Functions • Operates according to a rule to produce exactly one output value for each input value. • Can be represented as a rule written in words, or by an equation with two variables. (Most commonly x and y.)
x - value *The value substituted into the function. *The input *The domain
y-value *The value that results from the substitution of a given value into a function. (The answer.) *The output *The range
Example of a function domain: {5, 10, 15, 20} range: {1, 2, 3, 4} domain: {5, 4, 3, 2} range: {1, 2, 3, 2} x-values may NOT repeat for a set of data to be a function. Y-values may repeat. (ie. Each x can only have 1 y-value.)
non-examples of functions The input (x-value) of 2 has two outputs (y-values): 4 and 2. This is NOT a function.
4-4 Functions, Tables, and Graphs Course 2 Example 1: Completing a Function Table Find the output for each input. y = 8x + 5 Rule Input Output 8x + 5 x y Substitute –4 for x and simplify. –4 8(–4) + 5 –27 Substitute –2 for x and simplify. –2 8(–2) + 5 –11 Substitute 1 for x and simplify. 1 8(1) + 5 13
4-4 Functions, Tables, and Graphs Course 2 Example 2: Completing a Function Table Find the output for each input. y = 4x2 Rule Input Output 4x2 x y Substitute –3 for x and simplify. –3 4(–3)2 36 Substitute 0 for x and simplify. 0 4(0)2 0 Substitute 4 for x and simplify. 4 4(4)2 64
4-4 Functions, Tables, and Graphs Helpful Hint When writing an ordered pair, write the input value first and then the output value. Remember! An ordered pair is a pair of numbers that represents a point on a graph. Course 2 You can also use a graph to represent a function. The corresponding input and output values together form unique ordered pairs.
4-4 Functions, Tables, and Graphs Course 2 Example 3 : Graphing Functions with Ordered Pairs Make a function table for x = -2, -1, 0, 1, and 2, and graph the resulting ordered pairs. y 4 y = 3x – 4 Ordered Pair (2, 2) 2 Output Input Rule y (x, y) x 3x –4 x 4 –4 –2 2 (1, –1) –2 3(–2) – 4 –10 (–2, –10) –2 (0, –4) –7 (–1, –7) 3(–1) – 4 –1 –4 3(0) – 4 –4 (0, –4) 0 –6 (–1, –7) 1 3(1) – 4 –1 (1, –1) –8 2 3(2) – 4 (2, 2) 2 (–2, –10) –10
4-2 Tables and Graphs 10 y 8 6 4 2 0 x 4 –2 –8 –4 2 –6 6 10 8 –10 –2 –4 –6 –8 –10 Course 2 Insert Lesson Title Here Lesson Quiz: Part I 1. Write and graph the ordered pairs from the table. (-10, 10)• • (2, 6) (-4, -4) • (-6, -8)• The ordered pairs are (2, 6), (-10, 10), (-4, -4), and (-6, -8).
4-2 Tables and Graphs Course 2 Insert Lesson Title Here Lesson Quiz: Part II 2. The table shows the number of hours a student studies for a test and scores. Graph the data to find the number of correct answers after studying for 6 hours. What appears to be the relationship between the number of hours of study and the score? 90; the score is multiplied by 15.
4-4 Functions, Tables, and Graphs Course 2 Insert Lesson Title Here Lesson Quiz: Part III 3. Find the output for each input value. Input Rule Output x 4x – 1 y –9 4(-2) – 1 –2 –1 0 4(0) – 1 4 15 4(4) – 1
4-4 Functions, Tables, and Graphs y 4 (2, 3) (–2, 3) 2 x –4 –2 2 4 (0, –1) –2 –4 Course 2 Insert Lesson Title Here Lesson Quiz: Part IV 4. Make a function table with three input values for y = x2 – 1, and graph the resulting ordered pairs. Possible answer: x y (x, y) x2 – 1 –2 3 (-2, 3) –22 – 1 0 02 – 1 (0, –1) –1 2 22 – 1 (2, 3) 3