Download

1 / 9
90 likes | 98 Vues
2014 Farm Bill Commodity Programs ARC. Trent Milacek NW Area Ag Econ Specialist trent.milacek@okstate.edu 580-237-7677. Agricultural Risk Coverage (ARC). Provides revenue protection (price or yield losses) Option to choose individual farm (ARC-IC) or county level (ARC-CO) coverage

E N D
2014 Farm BillCommodity ProgramsARC Trent Milacek NW Area Ag Econ Specialist trent.milacek@okstate.edu 580-237-7677
Agricultural Risk Coverage (ARC) • Provides revenue protection (price or yield losses) • Option to choose individual farm (ARC-IC) or county level (ARC-CO) coverage • ARC-IC covers farm revenue shortfalls across all covered commodities planted on the farm level across all farms enrolled in ARC-IC in the state • ARC-CO protects against revenue shortfalls at the county level
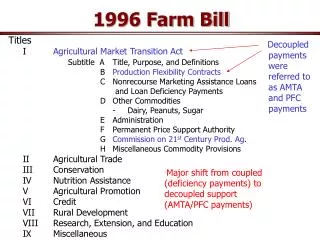
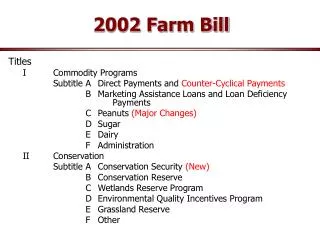
Agricultural Risk Coverage (ARC) • Similar to ACRE in 2008 farm bill • Key differences: • County level trigger (ACRE had a STATE/farm trigger) • Payment limited to 10% of the benchmark revenue (ACRE payment limited to 25% of benchmark) • Huge difference for OK wheat ($45-$60 ACRE payment compared to $16-$20 ARC payment)
ARC in more detail • Payments if per-acre revenues fall below 86% of benchmark • Benchmark: • County: 5-yr. Olympic avg. national price * 5-yr. Olympic avg. county yield • Farm: 5-yr Olympic average of the weighted per-acre revenues • Prices used to compute averages are higher of farm price or reference price • Maximum payment: 10% of benchmark (covers 76-86%)
How much Coverage Does ARC Provide • ARC-CO paid on 85% of base acres • Good option if your yields are similar to the county average. • Does not matter if you plant a covered commodity. • ARC-IC paid on 65% of base acres • Are your individual yields significantly higher than the county average? • Will you always be planting a covered commodity?
Alfalfa County ARC-CO Yields for 2014 2014 Benchmark RevenueMaximum ARC-CO Payment Canola: $0.22 * 1063 = $234 10% * $234 = $23 Corn: $5.29 * 56 = $298 10% * $298 = $30 Sorghum: $5.10 * 55 = $279 10% * $279 = $28 Soybeans: $12.27 * 20 = $241 10% * $241 = $24 Wheat: $6.60 * 33 = $218 10% * $218 = $22
Considerations for producers enrolled in ARC • Base acres can receive an ARC payment even if they are not planted to the enrolled commodity • ARC is a shallow loss safety-net program that may pay more often than PLC, but cannot cover major losses due to large decreases in price
References • Price Loss Coverage/ Agriculture Risk Coverage • (http://www.fsa.usda.gov/programs-and-services/arcplc_program/index) • Oklahoma State University Farm Bill Web Page • (http://agecon.okstate.edu/agpolicy/farmbill.asp) • Kansas State University Farm Bill Web Page • (https://www.agmanager.info/ag-policy/farm-bill)