Download
1 / 12
120 likes | 202 Vues
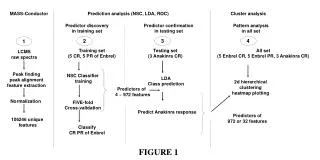
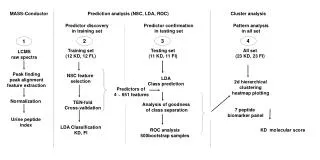
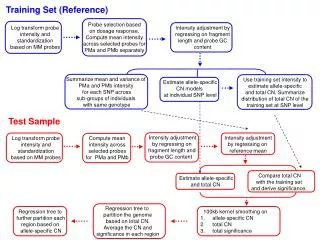
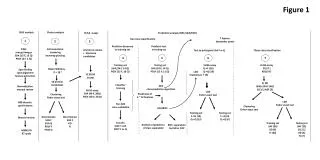
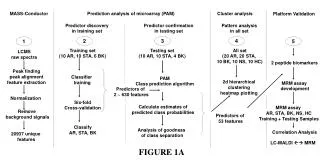
Figure 1. Cluster analysis. DIGE analysis. 2. Prediction analysis of microarray (PAM). 1. 2d hierarchical clustering heatmap plotting. DIGE raw gel images SJIA (13 F, 13 Q) POLY (5 F, 5 Q). Predictor discovery in training set. Class prediction in testing set. 6. 7. 3.

E N D
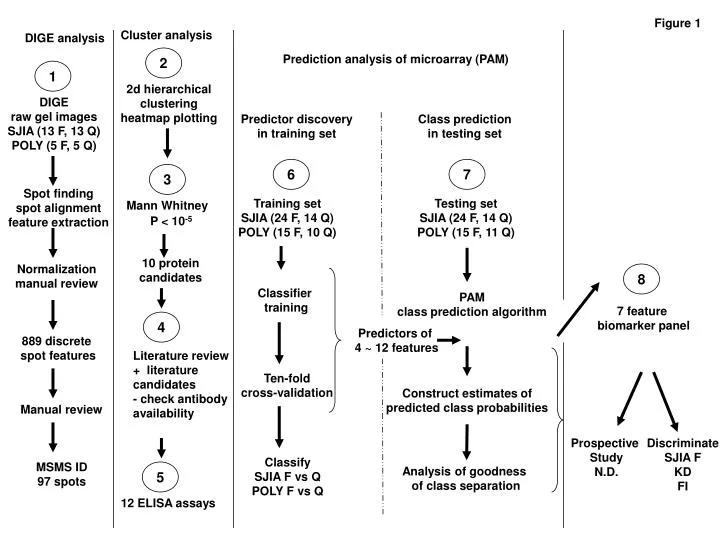
Figure 1 Cluster analysis DIGE analysis 2 Prediction analysis of microarray (PAM) 1 2d hierarchical clustering heatmap plotting DIGE raw gel images SJIA (13 F, 13 Q) POLY (5 F, 5 Q) Predictor discovery in training set Class prediction in testing set 6 7 3 Spot finding spot alignment feature extraction Training set SJIA (24 F, 14 Q) POLY (15 F, 10 Q) Testing set SJIA (24 F, 14 Q) POLY (15 F, 11 Q) Mann Whitney P < 10-5 10 protein candidates Normalization manual review 8 Classifier training PAM class prediction algorithm 7 feature biomarker panel 4 Predictors of 4 ~ 12 features 889 discrete spot features Literature review + literature candidates - check antibody availability Ten-fold cross-validation Construct estimates of predicted class probabilities Manual review Prospective Study N.D. Discriminate SJIA F KD FI Classify SJIA F vs Q POLY F vs Q MSMS ID 97 spots Analysis of goodness of class separation 5 12 ELISA assays
SJIA POLY F Q F Q Figure 2
SJIA F Q Figure 3
SJIA POLY F Q F Q Figure 4 SAP A2M APOAIV CFHR1 HP ATIII CRP ATIII HP GSN A2M A2M CFHR1 GSN GSN TTR GSN APOA1 A2M APOA1 ATIII APOA1 ATIII APOA1 TTR APOA1 APOA1 APOA1 APOA1 SAP APOIV APOIV APOA1 HP APOA1 CRP APOA1 HP MRP14 HP HP HP HP HP HP HP HP HP HP MRP8 MRP8 MRP8 MRP8 MRP14 SAA SAA SAA SAA SAA SAA
Figure 5A TRAINING TESTING POLY Q POLY F POLY Q POLY F
SJIA F SJIA Q SJIA Q Figure 5B TRAINING TESTING SJIA F
Figure 6A Goodness of class separation – D probability POLY Training POLY Testing Feature# 4 5 7 8 12 4 5 7 8 12
Figure 6B Goodness of class separation – D probability SJIA Training SJIA Testing Feature# 4 5 6 7 8 9 12 4 5 6 7 8 9 12
SJIA F SJIA Q SJIA Q Figure 7 TRAINING TESTING SJIA F
Figure 8 A B C Training set n = 38 Testing set n = 38 SJIA SJIA • Biomarker panel • of 7 members • HP • APO AI • A2M • SAP • CRP • MRP8/MRP14 • SAA Clinical diagnosis Clinical diagnosis F Q F Q 24 14 24 14 n = n = PAM PAM Classified as F Classified as F 18 5 21 4 Classified as Q Classified as Q 6 9 3 10 75% 64% 88% 71% Percent Agreement with clinical diagnosis + - Percent Agreement with clinical diagnosis + - 71% 82% Overall P < 0.05 Overall P < 0.001
SAP MRP14 1 23 Figure 9 SJIA F KD FI Data set n = 27 13 12 12 SJIA F NOT-SJIA F Clinical diagnosis 13 24 n = SAA MRP8 Unsupervised clustering HP Clustered as SJIA F 10 Clustered as NOT-SJIA F 3 CRP 77% 96% - Percent Agreement with clinical diagnosis + APOA1 85% Overall P < 10-5 A2M