Download
1 / 34
340 likes | 490 Vues
Exoplanet Microlensing Survey with the NEW Telescope (& WFIRST). David Bennett University of Notre Dame. WFIRST. Unique Science from Space-based Survey. Exoplanet Survey Question #1: How do planetary systems form and evolve? complementary to Kepler

E N D
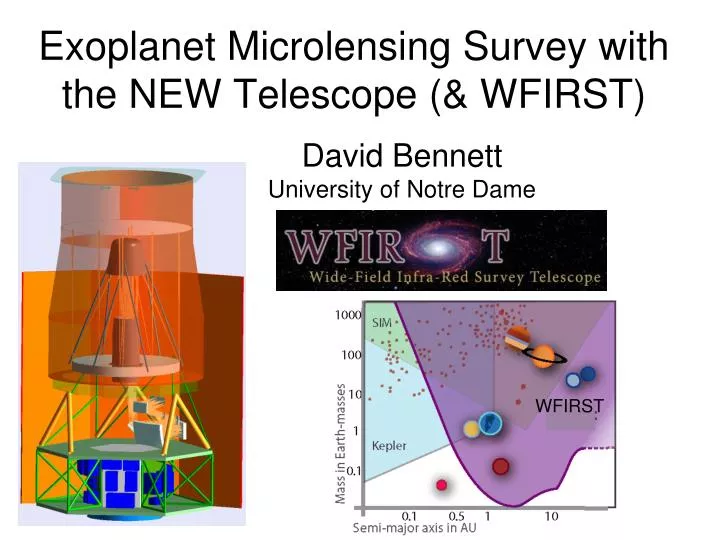
Exoplanet Microlensing Survey with the NEW Telescope (& WFIRST) David Bennett University of Notre Dame WFIRST
Unique Science from Space-based Survey • Exoplanet Survey Question #1: How do planetary systems form and evolve? • complementary to Kepler • Exoplanet sensitivity down to sub-Earth masses at 0.5 AU - ∞ • down to 0.1 Earth-masses over most of this range • free-floating planets down to 0.1 Earth-masses • free-floating planet mass distribution is important for understanding planet formation. • Exoplanet Survey Question #2: How common are potentially habitable worlds? • η= fraction of planetary systems with an earth-like planet in the outer habitable zone • But what is earth-like? • Kepler results imply a wide variety of planetary systems • We need to answer question #1 to understand habitability
Microlensing Target Fields are in the Galactic Bulge Galactic center Sun 8 kpc 1-7 kpc from Sun Light curve Source star and images Lens star and planet Telescope 10s of millions of stars in the Galactic bulge in order to detect planetary companions to stars in the Galactic disk and bulge.
Space vs. Ground Sensitivity ground Expect ~190 free-floating Earths space Habitable Earths orbiting G & K stars accessible only from space
How Low Can We Go? Limited by Source Size angular Einstein radius angular source star radius (Bennett & Rhie 1996) For E * : low-mass planet signals are rare and brief, but not weak Mars-mass planets detectable if solar-type sources can be monitored!
Ground-based confusion, space-based resolution CTIO HST • Space-based imaging needed for high precision photometry of main sequence source stars (at low magnification) and lens star detection • High Resolution + large field + 24hr duty cycle => Space-based Microlensing Survey • Space observations needed for sensitivity at a range of separations and mass determinations
High-magnification: Low-mass planets OGLE-2005-BLG-169Lb • Detection of a ~17 M planet in a Amax= 800 event • Caustic crossing signal is obvious when light curve is divided by a single lens curve. • Detection efficiency for ~10 M planets is << than for Jupiter-mass planets • Competing models with an Earth-mass planet had a signal of similar amplitude • So, an Earth-mass planet could have been detected in this event, if it had a separation ~ RE ! FUN, OGLE, MOA & PLANET
Close Separation planets by Microlensing • Faint main sequences sources needed to detecting low-mass planets • At separations < RE, planetary signals occur at low stellar magnification • Ground-based photometry seems to have systematic errors proportional to the flux of blended stellar light. • For close-in (or HZ) planets, higher angular resolution & longer exposures help s = 0.50 RE s = 0.25 RE
WFIRST vs. Kepler WFIRST – w/ extended mission Kepler ~12 yr mission Figures from B. MacIntosh of the ExoPlanet Task Force
Extraction of Exoplanet Light Curve Signal Time-series photometry is combined to uncover light curves of background source stars being lensed by foreground stars in the disk and bulge. Twice Earth Earth Half Earth No Planet 3 3.5 Magnification by stellar lens 3 Magnification 2.5 Magnification 2.5 Deviation Due to Planet 2 Offset from peak gives projected separation 2 1.5 -20 -10 0 10 20 9.2 9.4 9.6 9.8 Days Days Detailed fitting to the photometry yields the parameters of the detected planets. Planets are revealed as short-duration deviations from the smooth, symmetric magnification of the source due to the primary star.
Free Floating Planet Eventshave tE < 2 days M:lens mass MJ: Jupiter mass D:distance vt: velocity ~20 days for stars ~Neptune mass Sumi et al. 2011 As Many FFP as stars! WFIRST can detect Earth-mass FFP
WFIRST SDT Final Report is ObsoleteThere are issues with the exoplanet microlensing predictions • Data Rate restrictions were ignored for DRM-2 • With planned hardware, we can only observe 6 DRM-2 fields per 15 minute cycle (not 7) • Field locations and sampling was not optimized • Obsolete microlensing optical depth/rate numbers used
Microlensing Optical Depth & Rate WFIRST • MOA-II measures τ in vicinity of WFIRST field for 1st time (Sumi et al. 2012) • using 474 events with well measured microlensing parameters (215 in central fields) • luminosity function errors tend to cancel with all-star sample • Selection of Red Clump Giant source stars is problematic • due to blending and possible luminosity function errors • WFIRST SDT Final report on obsolete (on this point) Red Clump Stars Only
GSFC NRO Design These calculations use the GSFC design. “only” 18 H4RGs
WFIRST Field Selection & Data Rate Preliminary optimization of DRM1 and DRM2 fields, with central MOA fields used for microlensing rate measurement. 9 and 6 fields, respectively, when optimum is 10. Preliminary optimization of WFIRST-NRO fields, with central MOA fields used for microlensing rate measurement. L2 data rate limit is 5 fields. Optimum is 11 – assuming 15 minute sampling. Assumes 40 sec slew & settle – probably conservative – we’d do more fields if we could
Comparison of Earth-mass Detection Numbers Current L2 data rate limit makes L2 version of WFIRST inefficient. More pixels per star => fewer planet discoveries. Likely trade: L2-NRO will require more microlensing observing time and less dark energy time. But, a factor-of-2 increase in L2 downlink would remove this issue. Maybe a larger high-gain antenna would be enough? Photometry improvement from NRO is modest – but it may be more significant near the habitable zone. The results assume Cassan et al. (2012) exoplanet MF and a detection threshold of Δχ2 > 300 in mission simulations using an IR version of the Bennett & Rhie (2002) code.
W Ecliptic Sun Plane Equatorial Plane Orbit 23.5 28.7 Vernal Orbit Plane MPF field Equinox MPF in Geosynchronous Orbit W MPF’s orbit allows continuous view of Galactic bulge planet search field and continuous data data downlink to a dedicated ground station in White Sands.
Detector Radiation Shield for Outer van Allen Belt STScI Design MPF study indicates “sealed” multilayer shield can remove trapped e- radiation To get 100K focal plane may require multiple radiators protected by louvers
Lens System Properties • Einstein radius : E= *tE/t* and projected Einstein radius, • * = the angular radius of the star • from the microlensing parallax effect (due to Earth’s orbital motion).
Finite Source Effects & Microlensing Parallax Yield Lens System Mass • If only E or is measured, then we have a mass-distance relation. • Such a relation can be solved if we detect the lens star and use a mass-luminosity relation • This requires HST or ground-based adaptive optics • With E, , and lens star brightness, we have more constraints than parameters mass-distance relations:
HST Observations of OGLE-2003-BLG-235L/MOA-2003-BLG-53L Lens and source perfectly aligned during event Lens moves away form source after event, so centroid position of blended image is color dependent Relative proper motion rel= 3.30.4 mas/yr from light curve analysis (rel= */t*) implies 0.6 mas separation in B - I
HST Observation Predictions for OGLE-2003-BLG-235L/MOA-2003-BLG-53L Fraction of total flux due to lens star. Centroid Shift between HST-ACS/HRC passbands for follow-up images. (Units are 25 mas pixels.) Relative proper motion rel= 3.30.4 mas/yr from light curve analysis (rel= */t*)
Lens Star Identification from Space Simulated HST images: ML= 0.08 M • Lens-source proper motion gives E = reltE • rel= 8.40.6 mas/yr for OGLE-2005-BLG-169 • Simulated HST ACS/HRC F814W (I-band) single orbit image “stacks” taken 2.4 years after peak magnification • 2 native resolution • also detectable with HST WFPC2/PC & NICMOS/NIC1 • Stable HST PSF allows clear detection of PSF elongation signal • A main sequence lens of any mass is easily detected (for this event) ML= 0.35 M ML= 0.63 M binned raw image PSF subtracted
Stacked HST I-band Image of OGLE-2005-BLG-169 Source HST images taken 6.5 yrs after event Analysis by Jay Anderson
Subtracted Neighbor… PSF ISGOOD! Almost no residuals When we Subtract a PSF from a (brighter) neighbor
Subtracted F814W Stack This means that the residuals of the target-star subtraction are real.
Fit and Subtract Two Stars: Source & Lens Very good subtraction residuals when we fit for two sources
Two-source Solution: • Offset consistent in the F814W, F555W, and F438W data: • x = 1.25 pixels = 50 mas • y = 0.25 pixel = 10 mas • FLUX: (left) (right) • F814W 3392 e 3276 e- • F555W 2158 e 3985 e- • F438W 338 e 1029 e • fI = 0.51 • fV = 0.35 • fB = 0.25 HST BVI observations imply M* = 0.63 M Mp = 17 M observed separation of 51 mas confirms planet model prediction of 54.3±3.7 mas
High-magnification: Low-mass planets OGLE-2005-BLG-169Lb • Detection of a ~17 M planet in a Amax= 800 event • Caustic crossing signal is obvious when light curve is divided by a single lens curve. • Detection efficiency for ~10 M planets is << than for Jupiter-mass planets • Competing models with an Earth-mass planet had a signal of similar amplitude • So, an Earth-mass planet could have been detected in this event, if it had a separation ~ RE ! FUN, OGLE, MOA & PLANET
HST vs. WFIRST Astrometry • Our examples are all with HST data • 2.4m diffraction limited optics • Imaging at λ = 0.8 μm • ~40 mas/pixel • 6-8 images per passband • WFIRST • 1.1-2.4m diffraction limited optics • Imaging at λ = 1-2 μm • ~110-180 mas/pixel • 500-50,000 images per passband • Very wide filter 0.92-2.4 μm filter implies color dependent PSF • rel uncertainty scales as ~ FWHM2 so ~4× better w/ NRO
Relative Proper Motion Gaudi’s relative proper motion from White Paper for J = 23 source+lens
Lens Detection Provides Complete Lens Solution Estimates of the parameter uncertainties from these methods for the proposed Microlensing Planet Finder mission concept, which was one of 3 WFIRST precursors (Bennett, Anderson & Gaudi 2007). WFIRST should do at least as well as this. WFIRST-NRO should do much better.
However, the Central Bulge is More Crowded in the IR HST/WFPC2 CTIO Crowded fields give higher lensing rate, but complicate mass determination -> redundancy needed HST/WFC3/IR