Download
1 / 21
210 likes | 387 Vues
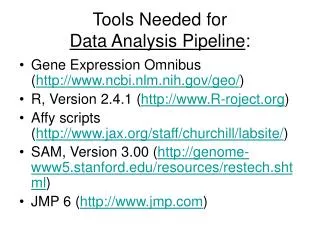
MDMS-A Web Tool to Manage & Analyze Gene Expression Microarray Data. Sachin Mathur. Overview. Steps in analysis of Gene Expression Microarray Data Preprocessing Filtering Statistical Analysis Machine Learning & Data Mining (Clustering) Functional Analysis Data Analysis features in MDMS

E N D
MDMS-A Web Tool to Manage & Analyze Gene Expression Microarray Data Sachin Mathur
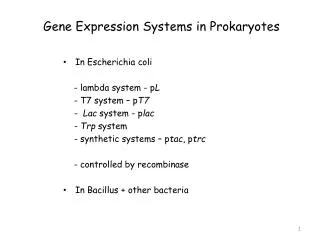
Overview • Steps in analysis of Gene Expression Microarray Data • Preprocessing • Filtering • Statistical Analysis • Machine Learning & Data Mining (Clustering) • Functional Analysis • Data Analysis features in MDMS • Workflow in MDMS • Analysis of Early Lung Development dataset using MDMS • MDMS Demo
Image Quantification & Quality Control Preprocessing Filtering Statistical Analysis Machine learning Functional Analysis Steps in Microarray Data Analysis Analysis of Data ~ Deriving Knowledgebase from Datum and mining Information from the knowledgebase
Steps in Microarray Data Analysis • Image Quantification • Check for artifacts, Segmentation • Extraction of expression values of genes • Preprocessing • Background Correction • Normalization • Summarization • MAS5, RMA, GC-RMA, DChip www.swegene.org/SWEGENE_microarray_eng.php?Id=18
Steps in Microarray Data Analysis • Filtering • About 10%-50% of the genome is not expressed in a given tissue • Aim is to isolate the genes that are expressed • Also helps in more accuracy in statistical significance tests • Specific & Non-specific filtering • Filter of Presence/Absence calls • Filter on expression signal, Variability in gene expression
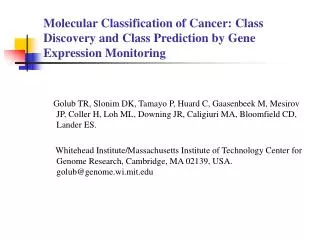
Steps in Microarray Data Analysis • Statistical Analysis • Many genes will be expressed to perform many routine tasks in the cell • Aim is to isolate genes responsible for phenotypic variation • Interesting Vs Random • Variant significance tests ~ T-Test, ANOVA • Multiple Testing Correction
Steps in Microarray Data Analysis • Machine Learning Approaches ~ Data Mining • Small changes in gene expressions can collectively regulate an important pathway, which by themselves may not be statistically significant • Limitations with fewer replicates and fitting approximate models on data during statistical analysis • Aim is to find significant patterns in the data set. • Periodic, Time-lagged, cyclic • Machine Learning approaches mine data for information ~ data mining using computational and statistical techniques (Eg Clustering)
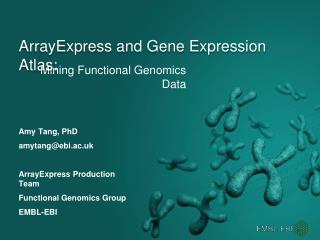
Functional Analysis • Functional Analysis • Given a statistically significant pattern or list significant of genes, how significant is it biologically? • Aim is to find genes that are responsible for the phenotypic condition • Extracting annotations and finding functionally similar genes. • Gene Ontology • Gene set enrichment, relating genes to known pathways http://cardioserve.nantes.inserm.fr/ptf-puce/images/camembert_go.gif
Data Analysis Features in MDMS • All data analysis features in MDMS are implemented through Bioconductor Package (http://www.bioconductor.org) • Covers many aspects of data analysis for Gene-Expression, SNP, Custom made arrays • Many different tests for quality control, preprocessing, filtering, statistical analysis, machine learning and functional analysis • Large user community, helpful mailing lists, used by many labs in many countries • Tutorials are available on the website and hands-on training is also available. • Better than all available packages in terms of coverage of data analysis aspects. • Open Source
Data Analysis Features in MDMS • MDMS supports Affymetrix Gene Expression arrays • No Image Quantification (usually done at microarray facility) • Quality Control • 3’/5’ bias • % Detection calls • Background signals • Correlation coefficients between arrays
MDMS - Preprocessing • Preprocessing • MAS5 – Default Affymetrix normalization • RMA – Robust Multichip Analysis • GC-RMA, DChip (Li-Wong) • MAS5 and RMA are highly recommended • Available literature shows significant advantages of RMA over MAS5
MDMS - Filtering • Filtering • Expression value cut-off • Eg. All genes > 200 • Detection calls • Eg. All genes that are detected as Present • Fold Change • Eg. All genes that have > 2 fold or less than -2 fold • Inter-Quartile Range (1st & 3rd quartiles) • For genes that show higher variability • All analysis is done on a log 2 scale
MDMS – Statistical Analysis • Significance Tests • LIMMA (Linear Models of Microarrays) • SAM (Significance Analysis of Microarrays) • EBAM (E-Bayes Analysis of Microarrays) • Correction for Multiple Testing • FDR, Bonferroni, Holm’s correction • Machine Learning • Clustering • Hierarchical Clustering, K-Means, Self Organizing Maps.
MDMS-Functional Analysis • Functional Analysis through GOAPhAR • Gene Annotation • Protein Annotation • Biological Pathways • Gene Ontology Annotation • Protein Interaction Evidence • All gene lists generated using the data analysis options can be saved in the database for future use. These can be also downloaded as text files.
MDMS-WORKFLOW Microarray Core USER Data Repository Software Rat2302, Hg133U MDMS Database Preprocessing Filtering Statistical Analysis Machine Learning GOAPhAR Annotation
Data Analysis Example • Data set specifications (GSE3541) • The aim of the study is to find genes involved in early lung development. • Mechanical Stress was applied to fetal type II endothelial cells taken from 19 day old rat embryos • Data set Processing • Data was preprocessed by MAS5 • Expression > 200, Invariant change between pairs of control & experiment samples > 50 (75% filtered) • SAM statistical method was used to find significant genes (92 genes, 63 up and 29 down-regulated) • 34 up-regulated genes were selected for further analysis
Biological Significance of Clusterings • K-Means was applied to 34 genes, with K=2, 3, 4, ….,29 • Random clusterings were generated for K = 2,3,4,…29 to compare the statistical clusterings to random • Biological significance scores were calculated for all clusterings. • A z-score and P-value was calculated for each K value
Biological Significance of Clusterings • The study found that genes related to amino acid synthesis, amino acid transport and sodium ion transport contributed to lung development. • 1 gene for sodium ion transport • 4 genes for amino acid transport were found in 2 clusters • 4 genes for amino acid synthesis were found in 2 clusters
MDMS • Demonstration - Using MDMS to analyze data
MDMS • Questions, comments, suggestions


![[VI]. Post-Transcriptional Processing and Post-Transcriptional Control of Gene Expression](https://cdn1.slideserve.com/3214110/vi-post-transcriptional-processing-and-post-transcriptional-control-of-gene-expression-dt.jpg)