Download
1 / 23
240 likes | 477 Vues
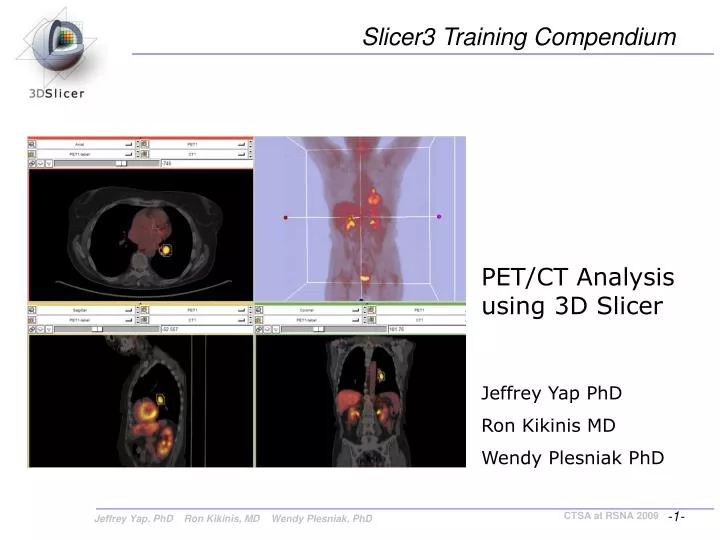
Slicer3 Training Compendium. PET/CT Analysis using 3D Slicer. Jeffrey Yap PhD Ron Kikinis MD Wendy Plesniak PhD. Study Data. CT acquisition: (jeff, please fill in anything relevant about the dataset) PET acquisition: (jeff, please fill in anything relevant about the dataset,

E N D
Slicer3 Training Compendium PET/CT Analysis using 3D Slicer Jeffrey Yap PhD Ron Kikinis MD Wendy Plesniak PhD
Study Data CT acquisition: (jeff, please fill in anything relevant about the dataset) PET acquisition: (jeff, please fill in anything relevant about the dataset, Isotope used, etc.)
Clinical Context Clinical relevance: (jeff) -underlying diagnosis -why were scans done -what was radiologist’s interpretation -treatment? -followup plan.
Clinical Context Tutorial context: -background: standard ways to evaluate response to treatment -how this tutorial addresses clinical needs -transition to specifics on SUV computation.
Brief Description of Quantitative Measurement: Standardized Uptake Value SUV (time) = Radioactive Concentration x Weight Injected Activity • Under certain circumstances, 18FDG SUV correlates with metabolic rate of glucose and/or the number of viable tumor cells • Simplified semi-quantitative measure that can be routinely performed in clinical PET studies • Adjusts for differences in patient size and injected activity
Making assessments from measurements: Responsecriteria • Complete response (CR): Complete resolution of all lesions • Partial Response (PR): >= 25% decrease in SUVmax • Stable Disease (SD): < 25% change • Progressive Disease (PD): >= 25% increase in SUVmax
Learning objective • This tutorial demonstrates how a pre-treatment and followup study are analyzed. • Following this simple tutorial, you’ll be able to use 3D Slicer to: • Load a MRML scene description file, • Achieve combined display of PET and CT data, • Make quantitative measurements of Standardized Uptake Value (SUV) within one or more volumes of interest
Slicer GUI overview Menu Toolbar The Graphical User Interface (GUI) of Slicer3 integrates five components: • the Menu Toolbar • the Module GUI Panel • the 3D Viewer • the Slice Viewer • the Slice and 3D View Controller 3DViewer Module GUI Panel Slice Viewer Slice and 3D View Controller
Load the MRML Scene Select File->Load Scene: This raises the Load Scene Interface • select the PETCTFusion-Tutorial-Scene.mrml file • double click the file, or click Open
Navigate to the PETCTFusion Module Using Modules Menubutton: Expose the menu and select the module called “PETCTFusion”. Note: The menu displays a categorized list of modules available in this version of Slicer. The All Modules menuitem shows all 95 modules in this version.
Explore the PETCTFusion Module Click on the Help & Acknowledgements Panel to see more information about this module. Clicking on any Grey Panel Title Bar will toggle it open and closed. Panels include: • Help & Acknowledgments • Data Fusion • Display • Quantitative Measures • Study Parameters
Select the Volumes to Display and Analyze In each of the volume selectors in the “Data Fusion” panel, select: the CT volumeCT1, the PET volume PET1, and the tumor mask PET1-label volume. When the PET volume is selected, a “wait message” will be displayed while parameters are read from DICOM header.
Adjust the combined display of PET and CT data In the “Display” panel, choose a colorization option for the PET volume from among Grey, Heat, or Spectrum. Adjust the window and level for CT1 and PET1 volumes. Adjust the Slices Fade Scale to jointly display the datasets.
Explore the dataset Explore: in the Slice Viewers, scroll through the slices to locate the green Tumor label and the yellow Liver label (used only to demonstrate multiple-VOI functionality).
View a specific axial slice Type –740 in the Axial Viewer’sSlice Number Entry widget to view the Tumor label. This displays the slicepositionedat -740 mm within the reference frame of the dataset.
View Tumor Label in all Slice Viewers To view all Slice Viewers to the Tumor Label: Select the Scene Snapshots menubutton: and choose “PreTreatmentPETCT” and the “Restore” option. Touch the Slices Fade Scale to update all viewers.
Compute SUV for all VOIs in the pre-treatment study In the “Quantitative Measures” panel, click the “Compute/Refresh” button. SUVmax and SUVmean for each VOI (represented by a different color in the label map) will be displayed in the table.
Compute SUVbw for follow-up study. Now select: the CT volume “CT2”, the PET volume PET2” and the Tumor Mask called “PET2-label” in the Data Fusion Panel. This dataset contains a green VOI that corresponds to the tumor segmentation the pre-treatment study.
Adjust display for follow-up study. Adjust the display for the follow-up study. You may want to adjust the Slices Fade Slider and manipulate the 3D View to refresh them.
Compute SUVbw for follow-up study. In the “Quantitative Measures” Panel, select Compute/Refresh to compute SUVbw for the green Tumor volume (and yellow liver volume).
Assess response with respect to this VOI Pre-Treatment Max SUVbw = Post-Treatment Max SUVbw = 8.019048 g/ml 9.351174 g/ml +16.61% (SD)
Summary • This tutorial has demonstrated: • use of an interactive interface to load a scene • the combined display of PET and CT volumes in a single visualization • a workflow to make quantitative measurements of Standardized Uptake Value (SUV) within a volume of interest
Acknowledgments Harvard Clinical and Translational Science Center National Alliance for Medical Image Computing (NA-MIC) Neuroimage Analysis Center (NAC) National Center for Image-Guided Therapy (NCIGT) Surgical Planning Laboratory, Brigham and Women’s Hospital