Download
1 / 19
190 likes | 591 Vues
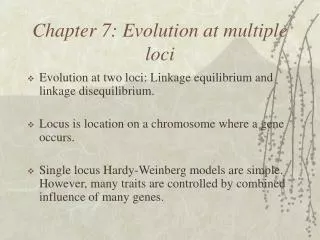
Understanding GWAS Chip Design – Linkage Disequilibrium and HapMap. Peter Castaldi January 29, 2013. Objectives. Introduce the concept of linkage disequilibrium (LD) Describe how the HapMap project provides publically available information on genetic variation and LD structure

E N D
Understanding GWAS Chip Design – Linkage Disequilibrium and HapMap Peter Castaldi January 29, 2013
Objectives • Introduce the concept of linkage disequilibrium (LD) • Describe how the HapMap project provides publically available information on genetic variation and LD structure • Review how LD enables genome-wide screens with only a subset of genome-wide SNP markers • Describe the design of chip-based genotype assays
Human Genome • 3 billion base pairs, 23 paired chromosomes • 99.9% sequence similarity between individuals • ~12 million variant sites
What are the Different Types of Genetic Variation? • Single base pair change (ACGT ATGT), aka Single Nucleotide Polymorphism • ~12 million across the genome • Insertions/Deletions (TGGTTTCTA TGGT---TA) • Can be of variable size • Trinucelotide repeats (microsatellites) • Highly polymorphic, less common than SNPs • Responsible for certain clinic disorders (Huntington’s, Fragile X, myotonic dystrophy)
SNPs in detail • SNPs can have up to four possible alleles (A,C,G,T), most have only two alleles present in human populations • Each person has two SNP alleles (one for each copy of the chromosome) • when both copies are the same, you’re homozygous (i.e. AA, CC, GG, TT). When they’re different (AT), your heterozygous. • Each allele has a frequency in which it appears in a given population • major allele (more common), minor allele (less common) • they sum to 1 (or 100%)
SNPs are Used as Genetic Markers for GWAS Chips • Properties of SNPs that make them good markers for GWAS • densely spaced across the genome • usually bi-allelic (only 2 alleles in the population, simplifies statistical tests) • GWAS chips can effectively represent most common variation with just a subset of SNPs • with ~500,000 SNPs, most common variation can be captured • this is because there is significant correlation between neighboring SNPs
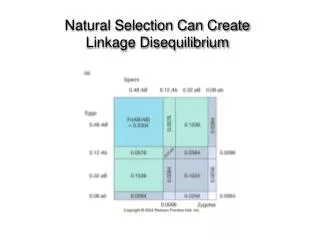
Linkage Disequilibrium Causes Correlation Between Neighboring SNPs • Mendel’s laws state that genes (alleles) are independently transferred across generations (random assortment – linkage equilibrium). • This is not the case when two genetic loci are physically close to each other. • When two physically close genetic loci are not randomly assorted, this is called linkage disequilibrium.
Linkage Equilibrium Arises Because of Meiotic Recombination http://kenpitts.net/hbio/8cell_repro/meiosis_pics.htm
Linkage and Recombination Paternal DNA Maternal DNA X x X X Y y y Gametogenesis y Z z z z From Paternal grandfather From Paternal grandmother X X y Y z z
Recombination Breaks Up Chromosomal Segments Over Generations recombination is not uniform across the genome (recombination hotspots). SNPs within the yellow region are correlated with each other and form haplotypes. Because of this correlation, one can often use a single SNP from a haplotype to represent all the SNP variation within a haplotype.
Haplotype Structure Reflects Evolutionary History The structure of haplotype blocks varies across racial groups African populations have short LD blocks, reflecting the longer evolutionary history of those populations
~500,000 SNP Markers Can Reasonably Represent Most of the Common Genetic Variation in European Genomes • GWAS relies upon linkage disequilibrium and the ubiquitous nature of SNP markers to enable genome-wide surveys of the impact of common variation on disease susceptibility Pe’er et al. Nat Gen. 2006
The HapMap Project is a catalog of human variation across populations • The Human Genome project provided the complete human sequence for a small number of individuals • To get an accurate sense of variable sites, data from many individuals is needed • HapMap has three iterations (http://hapmap.ncbi.nlm.nih.gov/) • dense genotype data from multiple populations groups • CEU – individuals of Northern and Western European ancestry from Utah • YRI – Yorubans from Nigeria • JPT – Japanese from Tokyo • CHB – Han Chinese from Beijing
Data from the HapMap Project Enabled GWAS Chip Design • Information from HapMap Used in chip design • panel of potential SNPs to use in a genotype chip • population specific LD structure to allow the identification of tag SNPs that effectively tag haplotypes
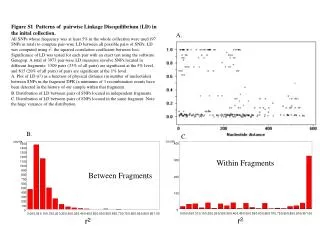
Using Linkage Disequilibrium to find Genes • Linkage disequilibrium (LD) means that sites of genetic variation can serve as “markers” for larger chromosomal segments. • Correlation between markers is quantified with r-squared and D’.
GWAS identify novel disease loci, but additional localization is often necessary
Genotype Chip Technology http://science-education.nih.gov/newsnapshots/TOC_Chips/Chips_RITN/How_Chips_Work_1/how_chips_work_1.html
Kang et al. The American Journal of Human Genetics Volume 74, Issue 3 2004 495 - 510
Summary • Genetic material is transmitted across generations in blocks called haplotypes. • Linkage disequilibrium and haplotype blocks allow for SNP tagging approaches that enable GWAS chips to capture common genetic variation with a subset of genetic markers. • Haplotype structure varies across ancestral groups. • The HapMap project catalogs human genetic variation and LD structure across populations.