Download
1 / 37
400 likes | 567 Vues
2010 Phased-Array Radar Innovative Sensing Experiment. Photo by Adam Smith. Photo by James Murnan. Pam Heinselman NSSL. Sebastian Torres NSSL and CIMMS. Daphne LaDue OU/CAPS. Heather Lazrus SSWIM. Photo by M. Benner. Acknowledgements. National Weather Center Contributions

E N D
2010 Phased-Array Radar Innovative Sensing Experiment Photo by Adam Smith Photo by James Murnan Pam HeinselmanNSSL Sebastian TorresNSSL and CIMMS Daphne LaDueOU/CAPS Heather Lazrus SSWIM Photo by M. Benner
Acknowledgements • National Weather Center Contributions • Signal processing techniques and software development • Ric Adams, Chris Curtis, Eddie Forren, Igor Ivic, Dave Priegnitz, John Thomson, David Warde (NSSL/CIMMS) • WARNGEN for WDSS-II • Charles Kerr & Kurt Hondl (NSSL/CIMMS) • David Andra and other fcsters at Norman WFO • WES cases • Mark Sessing, Darrel Kingfield, & Ben Baranowski (WDTB) • Playback Simulations • Kevin Manross (NSSL/CIMMS) • Experimental Warning Program Logistics • Greg Stumpf and Travis Smith (NSSL/CIMMS and MDL)
What’s Unique to PAR? Parabolic Antenna Single radiation element Single transmitter Single receiver Non-conformal Fixed beam pattern Mechanical steering Phased Array Antenna Multiple radiation elements Multiple transmitters Multiple receivers Conformal Variable beam pattern Electronic steering Unique Capabilities
PAR Electronic Beam Steering Want fields to interfere constructively in desired directions, and interfere destructively in the remaining space Scan To 30 deg BeamPerpendicular to the Array Adapted from Jeff Herd, MIT LL
Why a PAR at NSSL? The WSR-88D (NEXRAD) is ~20 years old End of life around the year 2020 Investigating replacement technology Affordability of new technology vs. operating costs for obsolete technology Improved weather surveillance capabilities e.g., faster updates Combine weather and aircraft surveillance networks Reduce number of radars Reduce maintenance costs + The MPAR Concept
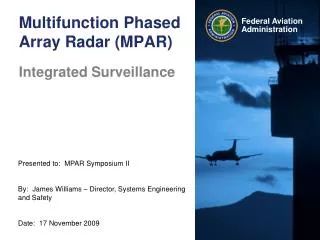
Multi-function PAR Concept Long-Range Surveillance Non-Cooperative Targets Severe Weather Weather Fronts WMD Cloud Terminal Surveillance
What is the NWRT PAR? National Weather Radar Testbed Phased-Array Radar + = Partnership SPY-1A Antenna Photo by A. Zahrai U.S. Navy Government Academia Private Industry NWRT PAR
Purpose of the NWRT PAR Which type of scanning improvement do forecasters consider most important? Stakeholders’ needs:Faster Updates Why are faster updates needed? • Tornado cyclone and mesocyclone evolution can occur in 10s of seconds • Significant storm evolution and transition between storm types can occur between WSR-88D scans • Mid and upper-level signatures indicative of downbursts are not reliably detected 62% Source: Radar Operations Center Source: LaDue et al. 2010, in press (BAMS) Determine how to best capitalize on PAR capabilities to address 21st century forecast and warning needs
Future PAR Design? What we have now Ultimate Goal
NWRT PAR Characteristics Beam Width 2.1 2.1 2.1 2.1 1.5 1.5 Characteristics Different from WSR-88D Sector Scans Polarization 10 km 90 90 Characteristics Similar to WSR-88D Wavelength: PAR = 9.4 cm / WSR-88D = ~10 cm (S-band) Range Resolution: PAR = 240 km / WSR-88D = 250 km
Signal Processing Upgrades • Data Quality: brings performance closer to that of operational radars • Artifact removal • Ground clutter, interference, DC bias, point targets • Range and velocity ambiguity mitigation • Calibration • Evolutionary: demonstrates PAR technology for weather applications • Faster updates • Range oversampling • Adaptive scanning Photo by M. Benner
Interference Filters Filters OFF Filters ON NWRT 1 May 200800:25 UTC
CLEAN-APCLutterEnvironment ANalysis Using Adaptive Processing NWRT10 Feb 09 16:19 NWRT10 Feb 09 16:19 CLEAN-AP is OFF Are these storms? CLEAN-AP is ON AP contamination was removed! KTLX Reflectivity All-bins filtering
Dynamic PRT Adjustmentvia the Radar Control Interface PRT Change
Want Faster Updates?There’s no such thing as a free lunch Adaptive Scanning Range Oversampling Full Scan Partial Scan Full ScanShort Obs. Time Faster updates Faster updates Less coverage Less accuracy
Range OversamplingA Signal Processing Solution ct /2L ct /2 ct /2 Traditional Sampling • Range oversampling (RO) adds more information without increasing the observation time • RO leads to overlapping radar volumes • RO results in more accurate estimates and/or faster updates These are cleverly combined for improved accuracy Oversampling
Data collected using same observation time Range OversamplingPerformance Demonstration Standard Processing Range Oversampling Processing A smoother field is an indication of more accurate data
Electronic Adaptive Scanning Conventional scanning Everywhere Sequential Adaptive scanning Areas of interest only Arbitrary Courtesy of Chris Curtis Goal: Faster Updates
What is ADAPTS? • Adaptive DSP Algorithm for PAR Timely Scans • Beam positions are classified as active or inactive • Only activebeam positions are scanned • Active beam positions are updated after every scan • Full surveillance volume scans are scheduled periodically ADAPTS determines active beam positions ADAPTS redetermines active beam positions EL EL EL EL EL EL tn tn+3 tn+2 tn+1 Scanning strategy schedule: SURV ADAPTS ADAPTS ADAPTS ADAPTS SURV ADAPTS Radar scans full surveillance volume Radar scans active beam positions Radar scans active beam positions Radar scans active beam positions Radar scans active beam positions Radar scans active beam positions tn tn+1 tn+2 tn+3 Surveillance update time AZ AZ AZ AZ AZ AZ time
How does ADAPTS work? • Active beam positions meet one or more criteria • Elevation angle • Continuity and coverage • Neighborhood Real-time display of active beam positions 1st Criterion 2nd Criterion 3rd Criterion EL up down Z coverage continuity AZ left right Zth Look around to respond to storm evolution Range Determine significant weather signals Always scan at the lower elevations
ADAPTS PerformanceQualitative Evaluation ADAPTS is OFF ADAPTS is ON 09 AUG 2008 – Reflectivity - 8.7 deg
ADAPTS PerformanceQuantitative Evaluation a) 1.4 1.3 1.2 Temporal Resolution (min) 1.1 1.0 0.9 0040:59 0104:35 0129:24 0154:27 0217:27 b) Time (UTC) 0040:59 0129:24 0217:27 200 km 150 km 100 km 200 km 150 km 100 km 200 km 150 km 100 km 1 May 2009 Nominal Update Time Time Savings ADAPTS Update Times 23
PARISE: MotivationNWRT PAR has unique capabilities Research Questions:1) How can technology be used to produced more focused, efficient, and effective weather surveillance? 2) Can improved understanding of storm processes be attained from high-temporal resolution data? 3) What are potential operational impacts of higher temporal resolution data on the warning decision process? 4) What additional warning lead time might be gained? Photos by James Murnan
NWRT PAR: More focused, efficient, effective weather surveillance? 1)Oversampled VCP 2)Weather-driven ADAPTIVE scanning Automated and Manual
What is an Oversampled VCP? Dense Vertical Sampling Most dense sampling near the ground Tilts chosen to sample storm extending to 18 km AGL w/in 20 km of the PAR Optimized when the max height uncertainty (%) is ~same at all ranges and heights of storm features (Brown et al. 2000) Overlapped Azimuthal Sampling 50% overlapped azimuthal sampling at all tilts to improve the apparent resolution of azimuthal signatures Data Quality Number of pulses for reflectivity and velocity estimates meet or exceed VCP 12 standards
Oversampled VCP Update Time: 2 min 22 tilts; max height uncertainty 18% Red lines = VCP 12
Weather-driven Adaptive Scanning Are storms located only w/in 120 km of NWRT PAR? No Yes Choose uniform-PRT version of Oversampled VCP and run ADAPTSMax Update Time: 1.4 min Choose split-cut-PRT version of Oversampled VCP and run ADAPTSMax Update Time: 2 min
Weather-driven AdaptiveScanning Are storms located only w/in 120 km of NWRT PAR? Are storms potentially tornadic? No Yes Are storms located within 120 km of PAR? Continue to sample as assessed above No Yes Choose 2-tilt, split-cut VCPUpdate Time: 22 sComposite Update Time: 2.7 min If only located w/in 120 km: Choose 4-tilt, uniform PRT VCPUpdate Time: 18 sComposite Update Time: 2.3 min Else: Choose 4-tilt, split-cut PRT VCPUpdate Time: 38 sComposite Update Time: 3.3 min
PARISE: MotivationNWRT PAR has unique capabilities Research Questions:1) How can technology be used to produced more focused, efficient, and effective weather surveillance? 2) Can improved understanding of storm processes be attained from high-temporal resolution data? 3) What are potential operational impacts of higher temporal resolution data on the warning decision process? 4) What additional warning lead time might be gained? Photos by James Murnan
Impacts on warning decision process? 1) How might higher temporal resolution data impact the warning decision process? 2) Will faster data updates increase warning lead time? How will we answer these questions? Tuesday Evening and WednesdayFor a variety of playback and real-time (hopefully!) cases, interrogate PAR data and issue warnings as you would in your office. After each event, discuss your experience in making warning decisions (or not) Thursday: Impact of Temporal Resolution Experiment Directly compare how forecasters (you!) issue warnings based on data provided at current radar update rates, with warnings issued based on faster data updates provided by Phased Array Radar (PAR). James Murnan
Your Goals! • Become comfortable using WDSS-II to interrogate storms and issue warnings • Issue warnings for 5 playback and/or real-time events • Participate in discussions on warning decision experience Photos by James Murnan
Impact of Temporal Resolution Experiment PurposeDetermine potential operational impact of temporal resolution on warning decision process and warning lead time • MethodControl and experiment groups • Control: PAR data degraded to WSR-88D update time • Experiment: PAR data with full-temporal resolution • Matched groups: You help us determine which pairings results in equivalent radar-interpretation skills 34
What you will do during experiment • Form two teams • Work through two cases • Gain situational awareness (WES) • Write an Area Forecast Discussion • Work through the case in displaced real time • Issue warning products as needed • Discuss your experience within your team • Contrast experiences with other team • Break for lunch / work through 2nd case / final debrief to end the day 35
Consent • Read through consent forms • Participation • Provides first rigorous test of impact of temporal resolution on warning decision process • Lasts one 8-hr workday • Provides opportunity to learn from each other • Is not completely confidential • Is not reimbursed above normal compensation • Is voluntary • Indicate your preference on quotation and recording 36
Today’s Schedule 2:45 Gain experience using Warning Decision Support System – Integrated Information (WDSS-II) 4:00 Tour National Weather Center 5:00 Group Dinner (wx dependent) 6:30 First playback or real-time event 9:00 End of day! Photos by James Murnan