Download
1 / 15
150 likes | 256 Vues
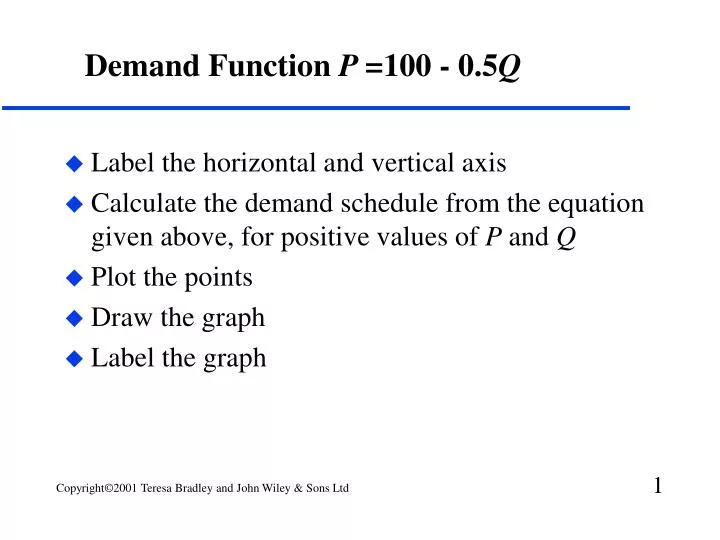
Label the horizontal and vertical axis Calculate the demand schedule from the equation given above, for positive values of P and Q Plot the points Draw the graph Label the graph. Demand Function P =100 - 0.5 Q. Table 2.3 Demand schedule Q P = 100 - 0.5 Q

E N D
Label the horizontal and vertical axis Calculate the demand schedule from the equation given above, for positive values of P and Q Plot the points Draw the graph Label the graph Demand Function P =100 - 0.5Q
Table 2.3 Demand schedule QP = 100 - 0.5Q 0P = 100 -0.5(0) = 100 40 P = 100 -0.5(40) = 80 80 P = 100 -0.5(80) = 60 120P = 100 -0.5(120) = 40 160P = 100 -0.5(160) = 20 200P = 100 -0.5(200) = 0 Intercept (vertical) = 100: Slope = - 0.5: Horizontal intercept = 200 Demand Function P =100 - 0.5Q : Calculate the demand schedule (Method A) P on the vertical (y)axis Q on the horizontal (x) axis
Table 2.3 Demand schedule Quantity (x) Price (y) 0 100 40 80 80 60 120 40 160 20 200 0 Intercept (vertical) = 100 Slope = - 0.5: Horizontal intercept = 200 Demand Function P =100 - 0.5Q : Plot the demand schedule P =100 - 0.5Q P Price 120 100 80 60 40 20 Q Quantity 0 0 40 80 120 160 200
Table 2.3 Demand schedule Quantity (x) Price (y) 0 100 40 80 80 60 120 40 160 20 200 0 Intercept (vertical) = 100 Slope = - 0.5: Horizontal intercept = 200 Demand Function P =100 - 0.5Q : Plot the demand schedule P =100 - 0.5Q P Price 120 100 80 60 40 20 Q Quantity 0 0 40 80 120 160 200
Table 2.3 Demand schedule Quantity (x) Price (y) 0 100 40 80 80 60 120 40 160 20 200 0 Intercept (vertical) = 100 Slope = - 0.5: Horizontal intercept = 200 Demand Function P =100 - 0.5Q : Plot the demand schedule P =100 - 0.5Q P Price 120 100 80 60 40 20 Q Quantity 0 0 40 80 120 160 200
Table 2.3 Demand schedule Quantity (x) Price (y) 0 100 40 80 80 60 12040 160 20 200 0 Intercept (vertical) = 100 Slope = - 0.5: Horizontal intercept = 200 Demand Function P =100 - 0.5Q : Plot the demand schedule P =100 - 0.5Q Price P 120 100 80 60 40 20 Q Quantity 0 0 40 80 120 160 200
Table 2.3 Demand schedule Quantity (x) Price (y) 0 100 40 80 80 60 120 40 16020 200 0 Intercept (vertical) = 100 Slope = - 0.5: Horizontal intercept = 200 Demand Function P =100 - 0.5Q : Plot the demand schedule P =100 - 0.5Q P Price 120 100 80 60 40 20 Quantity Q 0 0 40 80 120 160 200
Table 2.3 Demand schedule Quantity (x) Price (y) 0 100 40 80 80 60 120 40 160 20 200 0 Intercept (vertical) = 100 Slope = - 0.5: Horizontal intercept = 200 Demand Function P =100 - 0.5Q : Plot the demand schedule P =100 - 0.5Q P Price 120 100 80 60 40 20 0 Q Quantity 0 40 80 120 160 200 240
Table 2.3 Demand schedule Quantity (x) Price (y) 0 100 40 80 80 60 120 40 160 20 200 0 Intercept (vertical) = 100 Slope = - 0.5: Horizontal intercept = 200 Demand Function P =100 - 0.5Q : Plot the demand schedule P =100 - 0.5Q P Price 120 100 80 60 40 20 Q Quantity 0 0 40 80 120 160 200 240
Table 2.3 Demand schedule Quantity (x) Price (y) 0 100 40 80 80 60 120 40 160 20 200 0 Intercept (vertical) = 100 Slope = - 0.5: Horizontal intercept = 200 Demand Function P =100 - 0.5Q : Join the points and label the graph P =100 - 0.5Q P Price 120 100 80 P = 100 - 0.5 Q 60 40 D : Demand 20 Q Quantity 0 0 40 80 120 160 200 240 Figure 2.17
Table 2.3 Demand schedule Quantity (x) Price (y) 0 100 40 80 80 60 120 40 160 20 200 0 Intercept (vertical) = 100 Slope = - 0.5: Horizontal intercept = 200 Demand Function P =100 - 0.5Q : Alternatively, plot the vertical intercept (Method B) P Price 120 Vertical intercept = 100 100 80 60 40 20 Quantity 0 Q 40 80 120 160 200 240
Table 2.3 Demand schedule Quantity (x) Price (y) 0 100 40 80 80 60 120 40 160 20 200 0 Intercept (vertical) = 100 Slope = - 0.5: Horizontal intercept = 200 Demand Function P =100 - 0.5Q : and plot the horizontal intercept 120 Vertical intercept = 100 100 80 60 Horizontal intercept = 200 40 20 Q Quantity 0 0 40 80 120 160 200
Table 2.3 Demand schedule Quantity (x) Price (y) 0 100 40 80 80 60 120 40 160 20 200 0 Intercept (vertical) = 100 Slope = - 0.5: Horizontal intercept = 200 Demand Function P =100 - 0.5Q : Join the horizontal and vertical intercepts Join the horizontal and vertical intercepts P Price 120 100 80 60 : Demand D 40 20 Q Quantity 0 0 40 80 200 120 160 240 Figure 2.19
a 200 b The General Linear Demand function such as P = a - bQ P = 100 - 0.5Q P 120 a = 100 Slope = - = - 0.5 b 100 D 80 P = 100 - 0.5 Q 60 40 20 Q 0 0 200 40 80 120 160 240 Figure 2.19 Demand function, P = 100 - 0.5 Q
Table 2.4 Supply schedule Q: Quantity P: P = 10 +0.5Q 0 10: P =10 +0.5(0) 20 20: P = 10+0.5(20) 40 30 60 40 80 50 100 60 Intercept (vertical) = 10 Slope = 0.5 Horizontal intercept = - 20 P = 10 + 0.5Q Supply Function P = 10 + 0.5QCalculate and plot the supply schedule P = 10 + 0.5Q P S P = 10 + 0.5 Q Slope = 0.5 c = 10 Q Figure 2.22 NOTE: the supply function may be plotted by simply joining the intercepts