Download
1 / 12
120 likes | 130 Vues
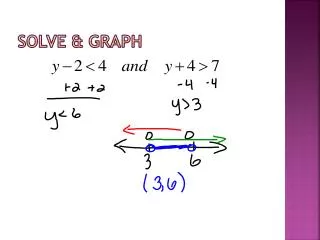
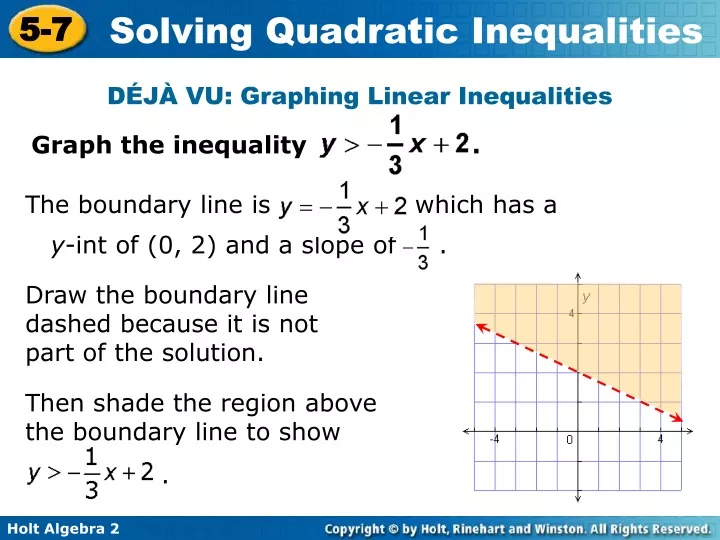
Then shade the region above the boundary line to show. The boundary line is which has a y -int of (0, 2) and a slope of. DÉJÀ VU: Graphing Linear Inequalities. Graph the inequality. Draw the boundary line dashed because it is not part of the solution.

E N D
Then shade the region above the boundary line to show . The boundary line is which has a y-int of (0, 2) and a slope of . DÉJÀ VU: Graphing Linear Inequalities Graph the inequality . Draw the boundary line dashed because it is not part of the solution.
Earlier we solved linear inequalities in two variables by graphing. We can use a similar procedure to graph quadratic inequalities.
Notes For A) f(x)= -x2 + 7 B) f(x)= x2 + 8x - 20 C) f(x)= -2(x-3)2 +7 Identify the vertex, and state the domain and range 2. For y > (x+1)2 – 3 A. State shifts B. Find vertex C. Graph (and shade) 3. Fory > -x2 – 4x A. Up or downward B. Find vertex C. Graph (and shade) 4. Fory ≤ x2 + 9x + 14 A. Up or downward B. Find vertex C. Find y-intercept D. Graph (& shade)
Notes Identify the vertex, state the domain and range for A) f(x)= -x2 + 7 B) f(x)= x2 + 8x – 20 C) f(x)= -2(x-3)2 +7 2. For y = (x+1)2 – 3 A. State shifts B. Find vertex C. Graph y > (x+1)2 – 3 (and shade)
Example 1: Graphing Quadratic Inequalities in Two Variables Graph y ≥ x2 – 7x + 10. Step 1 Graph the boundary of the related parabola y = x2 – 7x + 10 with a solid curve. Its y-int is (0,10), its vertex is (3.5, –2.25).
Example 1 Continued Step 2 Shade above the parabola because the solution consists of y-values greater than those on the parabola for corresponding x-values.
Example 2 Graph the inequality. y ≥ 2x2 – 5x – 2 Step 1 Graph the boundary of the related parabola y = 2x2 – 5x – 2 with a solid curve. Its y-int is (0,–2), its vertex is (1.3, –5.1).
Example 2 Continued Step 2 Shade above the parabola because the solution consists of y-values greater than those on the parabola for corresponding x-values.
Example 3 Graph each inequality. y < –3x2 – 6x – 7 Step 1 Graph the boundary of the related parabola y = –3x2 – 6x – 7 with a dashed curve. Its y-intercept is (0, –7).
Example 3 Continued Step 2 Shade below the parabola because the solution consists of y-values less than those on the parabola for corresponding x-values.
Notes 3. Fory > -x2 – 4x A. Up or downward B. Find vertex C. Graph (and shade) 4. Fory ≤ x2 + 9x + 14 A. Up or downward B. Find vertex C. Find y-intercept D. Graph (and shade)
Notes 4. Fory ≤ x2 + 9x + 14 A. State whether it opens upward or downward B. Find the vertex C. Find the y-intercept D. Graph the boundary line E. Shade