Download
1 / 28
280 likes | 361 Vues
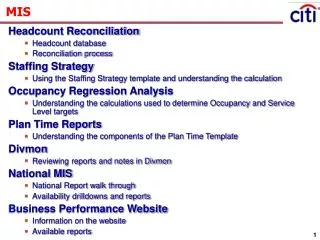
VA-OIG MIS Solution. M anagement I nformation S ystem. Agenda. Suite Introduction Our Environment Utilization of EWP data Team Central vs. Our Solution Examples of Our Reports. Suite Introduction. Our Environment. 217 TeamMate users 17 Divisions Quality Assurance Four person team.

E N D
VA-OIG MIS Solution Management Information System
Agenda • Suite Introduction • Our Environment • Utilization of EWP data • Team Central vs. Our Solution • Examples of Our Reports
Our Environment • 217 TeamMate users • 17 Divisions • Quality Assurance • Four person team
Team Central – Completed Projects report Can’t change width of column Can’t add or remove columns that the management wants to see
Our completed Projects report Everything you see here can be formatted the way you want it Grouped by Division, then each manager under that division We are showing the Start, Draft and Report Signed milestones. You could choose more or less to be displayed We are displaying the Title, Report number and Project number.
Any Questions Before we look at specific reports
About the Reports • 100% of form TeamMate • Real time • Parameters/Filters
Division Gantt Chart • Parameters • Division • Select a single division • Status • Defaults to show all planning, in-progress and completed projects • Fiscal Year • Defaults to show the prior, current, and next fiscal years • This report is designed to give you a visual representation of all the projects for a division. It is not designed to show every milestone date. • If you would like to see more information about a project you can click on the Gantt chart bar for that project. • This will show you every milestone (estimated and actual) along with other information such as time charged to the various phases.
In Progress Milestone Tracking • Parameters • DAIGAE and/or AIGAE • Defaults to show all projects for 52, 52A and 52B • Show Only Inspections • This is a yes/no parameter and allows you to view only Inspections • This report is designed to show all the milestones for a project. • For each milestone the report looks for the actual milestone, then the revised, then estimated. This way the report is showing the “current” date for that milestone. • Inspections will ALWAYS be on the last page because they have a different order of milestones than all other projects.
Progress Report • Parameters • DAIAGE or AIGAE • Defaults to show all projects for 52, 52A and 52B • Group Report by • Allows you to group the report by Scope or Division • Show Next Fiscal Year • Defaults to show the current and next fiscal year. This parameter will allow you to show/not show the next fiscal year. • This report is designed to show all the information about projects in the current and next fiscal year. • This report also combines several different reports into one.
All Projects by Division • Parameter • Division • Select a single division • This report is designed to compare estimated versus actual length and milestones for all projects in a division. • Page 2 is a vertical bar graph that compares the average estimated and actual lengths of each type of project for each fiscal year. • Page 3 is a vertical bar graph that shows the average days over/under for each milestone. • Starting on page four is a list of all projects by fiscal year followed by a detailed list of every project with all the estimated and actual milestones.
Other examples • Summary of Coaching Notes • Project assignments • Organization chart • Edit history
Benefits of this solution • All data is coming out of TeamMate • Formatting • Meaningful, Organized and Consistent • Monitor Performance • Ease of Access
Appendix A • Audit plan • Fiscal year the project was created • Entities • Area(s) the audit covers • Unit • Currently not used • Group • VA Office being audited • Type • VA business line • Location • Field office responsible • Scope • Type of deliverable • Origin • Where the project came from • Staff Type • DAIGAE or AIGAE responsible