Download
1 / 15
150 likes | 284 Vues
How Durham Fared in the recent housing crisis and the road to recovery. By Daniel Kindya December 9, 2010 Urban Economics. Introduction. In mid 2000’s, housing prices had hit all-time high. Subprime-mortgage rates and increased demand for housing led to housing boom.

E N D
How Durham Fared in the recent housing crisis and the road to recovery. By Daniel Kindya December 9, 2010 Urban Economics
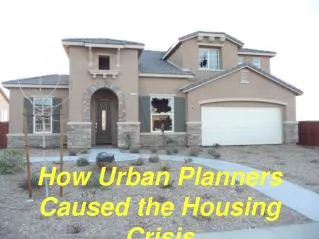
Introduction • In mid 2000’s, housing prices had hit all-time high. • Subprime-mortgage rates and increased demand for housing led to housing boom. • Many new homeowners were unable to pay mortgages. Caused foreclosures. • Hardest hit areas include California, Arizona, New England. • How did Durham fare? Photo Courtesy of epa.gov/kidshometour/tour.htm
Annual new privately-owned Residential Building permits A measurement of growth
Durham Building Permits • Expansion then decline. • Reasons and Foreclosures • Price trend • New home value increasing, old home value decreasing • First time homeowners more affected • Wealthier Durhamites less affected Data Courtesy of city-data.com and US Census Bureau
For comparison: Kent County, Delaware Building Permits • Why Kent County? A typical US county hit a typical amount by housing crisis. • Similar trends in beginning. • Larger spike than Durham (2000-2004: Durham 151%, Kent 239%) • Similar bust to Durham (2004-2009: Durham 38.2%, Kent 35.8%) Data Courtesy of US Census Bureau
For comparison: Maricopa County (Tempe, Arizona) Building Permits • Tempe, Arizona was one of hardest hit areas during housing bust. • Similar trends in beginning. • Smaller percentage spike than Durham (2000-2004: Durham 151%, Tempe 145%) • Much larger bust than Durham (2004-2009: Durham 38.2%, Tempe 13.4%) Data Courtesy of Us Census Bureau
Housing Units vs. Population A measurement of availability
Housing Units • Trend of increasing. • Large increases starting in late 80s until today due to growth of fringe Durham and decline in central city Durham. Data Courtesy of city-data.com
Population • Trend of growth. • Starts increasing more in mid 80s due to improvements in Durham and continues today. Data Courtesy of city-data.com Photo Courtesy of pulse.pospsmart,dk
Ratio • High ratio in 70s and 80s due to overcrowded central Durham neighborhoods. • Outer Durham growth in 90s reduced ratio. • Ratio grows a bit in 2000, finding equilibrium. • Housing boom in 2005 causes largest 5 year decrease in ratio. • 2010 numbers unavailable, but due to foreclosures overwhelmingly likely a higher ratio.
Home Loans Given by Durham Banks A measurement of demand
Loans vs. Population Trends Data Courtesy of city-data.com
Loans vs. Population Trends • Why Loans vs. % Change in Population? • Represents new homeowners • Shows not all increase in loans due to new residents. • Sharp increase starting in 2003, start of housing boom. • Peaks and falls in 2007 due to housing bust. • Numbers unavailable for past few years, but overwhelmingly likely Loans / Change in population value still low.
Conclusion • New homes built, Durham was hit an average amount. Not lightly, not as hard as other areas. • Overexpansion in the housing market caused a decrease in the Population / housing unit ratio. Foreclosures are driving the ratio back upwards. • Loans vs. % Change in Population shows that the expansion in the housing market during the boom was not just all new residents, but also first time Durham homeowners.
Questions? Comments? • Thank you for listening. • At this point I will be willing to answer any questions or comments you may have. • Sources • “Durham, North Carolina.” City-Data. Advameg Inc, 2010. Web. 2 Nov 2010. <http://www.city-data.com/city/Durham-North-Carolina.html>. • “Building Permits.” Censtats Database. US Census Bureau, 2010. Web. 2 Nov 2010. <http://censtats.census.gov/bldg/bldgprmt.shtml>.