Download
1 / 12
120 likes | 123 Vues
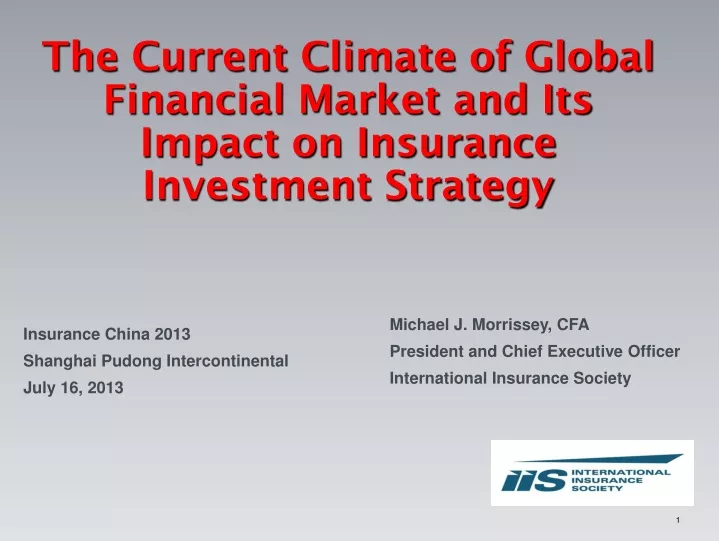
This article discusses the current climate of the global financial market and explores its impact on insurance investment strategies. It covers topics such as central bank policies, investment yield trends, ways to increase yield in a fixed income portfolio, and attractive investment options. The article also highlights the regulatory challenges faced by insurers in optimizing their capital usage.

E N D
The Current Climate of Global Financial Market and Its Impact on Insurance Investment Strategy • Michael J. Morrissey, CFA • President and Chief Executive Officer • International Insurance Society Insurance China 2013 Shanghai Pudong Intercontinental July 16, 2013
International Insurance Society • Oldest and Largest Industry Association • Members from 95 Countries • Executives, Regulators & Scholars • Open Forum for Discussion • Insurance Hall of Fame • IIS Annual Seminar
Global Growth is subdued 1.2% 5.3% 3.3% Emerging Markets Developed markets World Global growth below potential, Emerging Markets remain growth driver Source: Growth estimation for 2013, IMF World Economic Outlook | As of: April 2013
Central banksAggressive monetary policy • Conventional: ZIRP @ main Central Banks • Unconventional: Balance sheet expansion G4 central bank rates, in % Monetary base in % of nominal GDP Low for longer Massive liquidity injection Source: Bloomberg, As of: April 2013 Source: BoJ, BoE, Fed, ECB, own calculations, As of: April 2013Forecasts are based on assumptions, estimates, opinions and hypothetical models or analysis which may prove to be incorrect.
…leading to asset price appreciation • CB involvement supports financial markets • Global government yields near historic lows 10-year government yields Market moves since BoJ, in % Risky asset rally on CB activity Government yields well anchored Source: Bloomberg, As of: February 28, 2013 Source: JP Morgan, As of: May 2013
Investment yield trends are worrying Data Source: AM Best 2012 for US & UK composites, Euro Life from: Bank of America - Insurance Pan-Euro (2011 & 2012 are estimated) Investment Yield: Measures the average return on a company's invested assets by dividing the company's annual net investment income by the mean of cash and net invested assets. This return measure is before capital gains/losses and before income taxes. Barclays Global Aggregate Index YTW as of 5/28/2013.
Investment income is dropping quickly Annual investment income (millions), €5 billion portfolio Estimated This information is a forecast and due to a variety of uncertainties, and assumptions made in our analysis, actual events or results or the actual performance of the markets covered may differ from those presented. Assumptions: US P&C and Life Industry statistics (AM Best 2012) used to proxy a typical insurance investment portfolio, investment income, and accounting income levels. Market yield of 1.83% (Barclays Global Aggregate YTW 5/28/2013) used to estimate current market yields. Decline from 2012 to 3-5yr Estimate assumes implied book yield s fall to current market yields
How do investors obtain yield and return going forward? • There are five ways of increasing yield in a fixed income portfolio: • Duration. Increasingly a concern the longer interest rates stay low • Leverage. If available, fewer investors can utilize it • Volatility. Convexity is working against you • Liquidity. Should be a part of the portfolio • Credit. Still provides compelling relative value Certain non-fixed income classes also add to yield: • Real estate and infrastructure • Dividend-focused equities Other non-fixed income classes add to return, but not yield: • Private equity, commodities, hedge funds
Where to find attractive returns today? Emerging Market Sovereigns • Lower indebtedness and higher economic growth support Emerging Market Corporates • Growing market segment • Offering yield and diversification Structured Finance / CLO • Improving fundamentals • Rising market activity Infrastructure debt/ RE Mezzanine debt • Opportunity for liability driven investors • Return premium driven by illiquidity and scarcity Convertibles • Equity participation at lower capital charges • Market ‘normalization‘ offers opportunities Equities • Low correlation to bonds enables diversification • Comparably undervalued For illustrative purposes only. Past performance does not guarantee future results.This information is a forecast and due to a variety of uncertainties, and assumptions made in our analysis, actual events or results or the actual performance of the markets covered may differ from those presented.
Regulations are pushing insurers away from the optimal economic use of capital QIS 5 Asset Class Spread Risk Capital (per yr/dur) Charge Corporate Bonds AAA 0.90 1.80 AA 1.10 2.20 A 1.40 2.80 BBB 2.50 5.00 BB 4.50 9.00 B or lower 7.50 15.00 Unrated 3.00 6.00 Senior Financials (AA) 1.10 2.20 Covered Bonds (AAA) 0.60 1.20 Government Bonds 0.00 0.00 Global Equities 30.00 Property 25.00 Capital charge based on a duration of 2 years and ignoring interest rate risk in respect of asset and liability mismatches for bonds. Global equities are shown after cyclical adjustment. • Government debt carries zero spread risk • Other debt instruments carry capital charges which increase as credit quality reduces and duration increases • Private debt (e.g. bank loans, infrastructure debt and real estate debt) all suffer from not normally being rated thereby typically picking up a larger capital charge • Equities have the highest capital charges, especially "Other Equity" • Mortgage loans for residential property with low loan to value ratios can be constructed to give an almost zero capital charge • Anything structured is treated very harshly by the standard model For illustrative purposes only. This information is a forecast and due to a variety of uncertainties, and assumptions made in our analysis, actual events or results or the actual performance of the markets covered may differ from those presented. Past performance is guarantee of future results. Source: , CEIOPS, LBBW Credit Research