Download
1 / 63
630 likes | 869 Vues
HSM Practitioners Guide to Rural Multilane Highways and Urban Suburban Multilane Streets. - Session #5. Prediction of Crash Frequency for Suburban/Urban Multilane Streets. Predicting Crash Frequency of Suburban/Urban Multilane Streets.

E N D
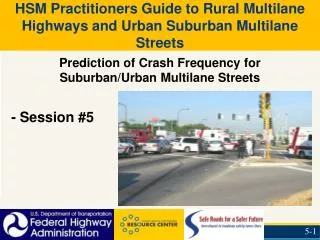
HSM Practitioners Guide to Rural Multilane Highways and Urban Suburban Multilane Streets - Session #5 Prediction of Crash Frequency for Suburban/Urban Multilane Streets
Predicting Crash Frequency of Suburban/Urban Multilane Streets • Describe the models to Predict Crash Frequency for Multilane Suburban/Urban Streets • Describe Crash Modification Factors for Multilane Suburban/Urban Streets • Apply Crash Modification Factors (CMF’s) to Predicted Crash Frequency for Multilane Suburban/Urban Streets Learning Outcomes:
Defining Urban Multilane Highways • HSM Methodology applies to arterial four-lane undivided and divided urban and suburban highways. • Urban and Suburban areas are defined as areas within the urban and urbanized area boundaries established by FHWA. These include all areas with populations of 5,000 or more. • Some areas beyond the FHWA boundaries may be treated as urban or suburban if the boundaries have not been adjusted to include recent development. • The boundary dividing rural and urban areas can at times be difficult to determine, especially since most multilane rural highways are located on the outskirts of urban agglomerations. • These procedures may be used for any multilane road in which the general design features and land use setting are urban or suburban in nature rather than rural.
Predicting Crash Frequency of Suburban/Urban Multilane Streets Separate Prediction Models for: • Homogeneous highway segments • Intersections • Sum of Individual Intersection Calculations
Definition of Segments and Intersections A - All crashes that occur within this region are classified as intersection crashes B – Crashes in this region may be segment or intersection related, depending on the characteristics of the crash
Subdividing Roadway Segments • Before applying the safety prediction methodology to an existing or proposed rural segment facility, the roadway must be divided into analysis units consisting of individual homogeneous roadway segments and intersections. • A new analysis section begins at each location where the value of one of the following variables changes (alternatively a section is defined as homogenous if none of these variables changes within the section): • • Annual Average daily traffic (AADT) volume (veh/day) • • Number of through lanes • • Presence/Type of a median • Presence/Type of Parking • Roadside Fixed Object density • Presence of Lighting • • Speed category
Subdividing Roadway Segments • homogeneous roadway segments – Median Width:
Predicting Crash Frequency of Suburban/Urban Multilane Streets • Procedure for safety prediction for a roadway segment: • Combine base models, CMFs, and calibration factor • Nspf rs = Nbrmv + Nbrsv + Nbrdwy • Nbr = Nspf rs (CMF1r x CMF2r x … CMFnr) • Npredicted rs = (Nbr + Npedr + Nbiker) Cr
Crash Frequency Prediction Models for Urban/Suburban Roadway Segments Five types of Collisions are considered: Multiple-vehicle nondriveway crashes Single-vehicle crashes Multiple-vehicle driveway related crashes Vehicle-pedestrian crashes Vehicle-bicycle collisions
Predicting Crash Frequency of Suburban/Urban Multilane Streets Nspf rs = Nbrmv + Nbrsv + Nbrdwy Where: • Nbrmv = Predicted number of multiple-vehicle non-driveway crashes per year for base conditions • Nbrsv = Predicted number of single-vehicle collision and non-collision crashes per year for base conditions • Nbrdwy = Predicted number of multiple-vehicle driveway related crashes per year
Predicting Crash Frequency of Suburban/Urban Multilane Streets Nbr = Nspf rs x (CMF1r x CMF2r x .. CMFnr) Where: • Nbr= Predicted number of total roadway segment crashes per year with CMFs applied (excluding ped and bike collisions) • Nspf rs = Predicted number of total roadway segment crashes per year for base conditions • CMF1r CMF2r, .. CMFnr= Crash Modification Factors for roadway segments
Predicting Crash Frequency of Suburban/Urban Multilane Streets Npredicted rs = (Nbr + Npedr + Nbiker) Cr Where: Npredicted rs = Predicted number of total roadway segment crashes per year Nbr= Predicted number of total roadway segment crashes per year with CMFs applied Npedr = Predicted number of vehicle-pedestrian collisions per year Nbiker = Predicted number of vehicle-bicycle collisions per year Cr = calibration factor for a particular geographical area
Combining Safety Predictions for an Entire Series of Segments Ntotalpredicted = Sum Nrs + Sum Nint Where: Ntotal predicted = Predicted crash frequency for the entire arterial street Nrs= Predicted number of total roadway segment crashes Nint= Predicted number of total intersection- related crashes
Crash Frequency Prediction Models for Urban/Suburban Roadway Segments Base Models and Adjustment Factors addresses five types of Roadway Segments: • (2U) Two-lane undivided arterials • (3T) Three-lane arterials including a center two-way Left Turn Lane • (4U) Four-lane undivided arterials • (4D) Four-lane divided arterials (including a raised or depressed median) • (5T) Five-lane arterials including a center TWLTL
Crash Frequency Prediction Models for Urban/Suburban Roadway Segments • No procedure has been developed for application to six-lane undivided (6U) nor for six-lane divided (6D) arterials. • - Until such procedures are developed: • The procedures for 4U arterials may be applied to 6U arterials and for 4D arterials to 6D arterials. • These procedures should be applied cautiously to 6U and 6D arterials because this application is not based on data for 6U and 6D arterials.
Crash Frequency Prediction Models for Urban/Suburban Roadway Segments Nspf rs = Nbrmv + Nbrsv + Nbrdwy Multiple-Vehicle NonDriveway Crashes Nbrmv = exp(a + b ln(AADT) + ln(L)) Where: AADT = Annual Average Daily Traffic (veh/day) L = Length of roadway segment (mi) a & b = regression coefficients (Table 12-3)
Multiple-Vehicle NonDriveway Crashes Nbrmv = exp(a + b ln(AADT) + ln(L))
Predicting Crash Frequency for a Suburban Street – Example: • 4-lane Undivided commercial Suburban Street: • AADT = 24,000 • Length = 3.6 miles 1st, Calculate Predicted Crash Frequency for Multiple-Vehicle NonDriveway Crashes - use 4U coefficients from Table 12-3 Nbrmv= exp(a + b ln(AADT) + ln(L)) = exp(-11.63 + 1.33 ln(24,000) + ln(3.6)) = exp(3.065) = 21.4 crashes/yr
Safety Performance Function (SPF) Highway Safety Manual Approach: Average Crash Rate “one rate”
“Is this a Higher Crash Frequency Site?” Highway Safety Manual Approach: “Substantive Crash Frequency” 17 crashes/yr “Difference” “Predicted Crash Frequency” 2.5 crashes/yr
Crash Frequency Prediction Models for Urban/Suburban Roadway Segments Nspf rs = Nbrmv + Nbrsv + Nbrdwy Single-Vehicle Crashes Nbrsv = exp(a + b ln(AADT) + ln(L)) Where: AADT = Annual Average Daily Traffic (veh/day) L = Length of roadway segment (mi) a & b = regression coefficients (Table 12-5)
Single Vehicle NonDriveway Crashes Nbrsv = exp(a + b ln(AADT) + ln(L))
Predicting Crash Frequency for a Suburban Street – Example: • 4-lane Undivided commercial Suburban Street: • AADT = 24,000 • Length = 3.6 miles - Predicted Crash Frequency for Single-Vehicle NonDriveway Crashes - use 4U coefficients from Table 12-5 Nbrsv = exp(a + b ln(AADT) + ln(L)) = exp(-7.99 + 0.81ln(24,000) + ln(3.6)) = exp(1.46) = 4.3 crashes/yr
Driveway Related Crashes • 72% of driveway related crashes involve a left turning vehicle – either into, or out of, the driveway *FHWA-SA-10-002 Access Management in the Vicinity of Intersections
Predicting Crash Frequency of Suburban/Urban Multilane Streets Multiple-Vehicle Driveway Related Crashes • Major driveways are those that serve 50 or more parking spaces • Minor driveways serve sites with less than 50 parking spaces • Major residential driveways have AADT greater than 900 vpd • Minor residential driveways have “AADT less than 900 vpd”
Predicting Crash Frequency of Suburban/Urban Multilane Streets Nspf rs = Nbrmv + Nbrsv + Nbrdwy Multiple-Vehicle Driveway Related Crashes Nbrdwy = SUM (nj Nj (AADT/15,000)t ) • Where: • nj = number of driveways within roadway segment of driveway type j • Nj = Number of crashes per year for an individual driveway of driveway type j from Table 12-7 • t = coefficient for traffic volume adjustment • AADT = Annual Average Daily Traffic (veh/day)
Multiple-Vehicle Driveway Crashes Nbrdwy = SUM (nj Nj (AADT/15,000)t ) Nj t Major driveways are those that serve sites with 50 or more parking spaces. Minor driveways are those that serve sites with less than 50 parking spaces.
Predicting Crash Frequency for a Suburban Street – Example: Nbrdwy = SUM (nj Nj (AADT/15,000)t ) • 4-lane Undivided commercial Suburban Street: • AADT = 24,000 • Length = 3.6 miles • 3 major commercial driveways • 42 minor commercial driveways • 2 major industrial/institutional driveways • 5 major residential driveways • 2 minor residential driveways • 7 other • 61 total driveways
Predicting Crash Frequency for a Suburban Street – Example: 4-lane Undivided commercial Suburban Street: (Using 4U coefficients from Table 12-7) Nbrdwy = SUM (nj Nj (AADT/15,000)t ) = 3 x 0.182 (24,000/15,000)1.172 + 42 x 0.058 (24,000/15,000)1.172 + 2 x 0.198 (24,000/15,000)1.172 + 0 x 0.026 (24,000/15,000)1.172 + 5 x 0.096 (24,000/15,000)1.172 + 2 x 0.018 (24,000/15,000)1.172 + 7 x 0.029 (24,000/15,000)1.172 = 7.1 crashes/yr
Predicting Crash Frequency of Suburban/Urban Multilane Streets Nspf rs = Nbrmv + Nbrsv + Nbrdwy Where: Nspf rs = Predicted number of total roadway segment crashes per year for base conditions for suburban 4-Lane Undivided (4U) of 24,000 AADT for 3.6 miles Nbrmv = 21.4 Nbrsv = 4.3 Nbrdwy = 7.1 Nspf rs = 21.4 + 4.3 + 7.1 = 32.8 crashes per year
Applying Severity Index to Urban Suburban Multilane Streets Example: Suburban Four Lane Undivided Segment (4U) street of 24,000 AADT for 3.6 miles; Fatal and Injury crashes are 15 of 40 total crashes • a. Compute the actual Severity Index (SI) • SI4sg = Fatal + Injury Crashes = 15/40 = 0.375 • Total Crashes
Applying Severity Index to Urban Suburban Multilane Streets b. Compute Predicted Fatal + Injury Crashes Nbrmv = exp(-12.08 + 1.25ln( 24,000) + ln(3.6)) = 6.1
Applying Severity Index to Urban Suburban Multilane Streets b. Compute Predicted Fatal + Injury Crashes Nbrsv = exp(-7.37 + 0.61ln( 24,000) + ln(3.6)) = 1.1
Applying Severity Index to Urban Suburban Multilane Streets b. Compute Predicted Fatal + Injury Crashes Nbrdwy = Nbrdwy x Coefficient = 7.1 x 0.342 = 2.4 crashes per year
Applying Severity Index to Urban Suburban Multilane Intersections Example: Suburban Four Lane Undivided Segment (4U) street of 24,000 ADT for 3.6 miles; Fatal and Injury crashes are 15 of 40 total crashes a. Compute the actual Severity Index (SI) SI = Fatal + Injury Crashes = 15/40 = 0.375 Total Crashes b. Compute the Predicted Severity Index (SI) SI = Fatal + Injury Crashes = (6.1+1.1+2.4)/32.8 Total Crashes = 0.293 • Actual Severity is greater than Predicted Severity
Applying CMF’s for Conditions other than “Base” - Next Step is: Nbr = Nspf rs(CMF1r x CMF2r x .. CMFnr) Where: • Nbr= Predicted number of total roadway segment crashes per year with CMFs applied • Nspf rs = Predicted number of total roadway segment crashes per year for base conditions • CMF1r CMF2r, .. CMFnr = Crash modification factors for roadway segments
CMF for Curb Parking on Urban Streets CMF1r = 1 + Ppk* (fpk-1.0) Where: Ppk = Proportion of curb length with parking, = (0.5Lpk/L) Lpk = curb length with on-street parking, both sides (mi) combined fpk = factor from Table 12-19
CMF for Curb Parking on Urban Streets Example: For 4-Ln Urban commercial street (4U), angleparking one side 3.12 miles of 3.6 mile length, commercial area: CMF1r = 1 + Ppk (fpk-1.0) CMF1r = 1 + (0.50 (Lpk/L)1 ) x (fpk-1) = 1 + (0.50 (3.12/3.6)1) x (3.999-1) = 1 + (0.50(0.867)) x 2.999 = 1 + (0.43 x 2.999) = 2.30
CMF for Curb Parking Urban Streets: Example For 4-Ln Urban commercial street (4U), parallelparking both sides 3.12 miles of 3.6 mile length, commercial area: CMF1r = 1 + Ppk (fpk-1.0) CMF1r = 1 + (0.50(3.12/3.6)2) x (1.709 -1)) = 1 + (0.5(0.867)2) x 0.709 = 1 + (0.867 x 0.709) = 1.614
CMF for Roadside Fixed Objects CMF2r = foffset * Dfo * pfo + (1 – pfo) Where: foffset= fixed object offset factor from Table 12-20 Dfo = fixed object density (fixed objects/mi) pfo = fixed-object collisions as a proportion of total crashes, Table 12-21 • Only point objects that are 4inches or more in diameter and do not have a breakaway design are considered. • Point objects that are within 70 feet of each other longitudinally are considered as a single object
CMF for Roadside Fixed Objects Example: For 4-Ln Urban undivided street (4U) with power poles at 2 ft offset foffset = 0.232 pfo = 0.037 • Offset is measured from edge of travel way
CMF for Roadside Fixed Objects: Example For one mile of 4-Ln Urban undivided commercial curbed street (4U) with power poles on oneside on 150 foot spacing 2 feet from edge of travel way: CMF2r = foffset x Dfo x pfo + (1 – pfo) = 0.232 (5280/150)(1)(0.037)+ (1 – 0.037) = 0.232 x 35.2 x 0.037+ (0.963) = 0.302 + 0.963 = 1.265
CMF for Roadside Fixed Objects: Example For one mile of 4-Ln Urban undivided commercial curbed street (4U) with power poles on bothsides on 150 foot spacing 2 feet from edge of travel way: CMF2r = foffset x Dfo x pfo + (1 – pfo) = 0.232 (5280/150)(2)(0.037))+(1 – 0.037) = 0.232 x 70.4 x 0.037+ (0.963) = 1.567
CMF3r for Median Width – Urban/Suburban Multilane Streets • This CMF applies only to divided roadway segments with traversable medians without barrier. • The effect of traffic barriers on safety would be expected to be a function of barrier type and offset, rather than the median width; however, the effects of these factors on safety have not been quantified. Until better information is available, an CMF value of 1.00 is used for medians with traffic barriers.
CMF for Lighting CMF4r = 1- (pnr x (1.0 – 0.72 pinr – 0.83 ppnr )) Where: pinr = proportion of total nighttime crashes for unlighted roadway segments that involve a nonfatal injury ppnr= proportion of total nighttime crashes for unlighted roadway segments that involve PDO crashes only pnr = proportion of total crashes for unlighted roadway segments that occur at night
CMF for Lighting CMF4r = 1- [pnr x (1.0 – 0.72 pinr – 0.83 ppnr ) ] • These are default values for nighttime crash proportions; replace with local information • If light installation increases the density of roadside fixed objects, adjust CMF2r