Download
1 / 17
170 likes | 271 Vues
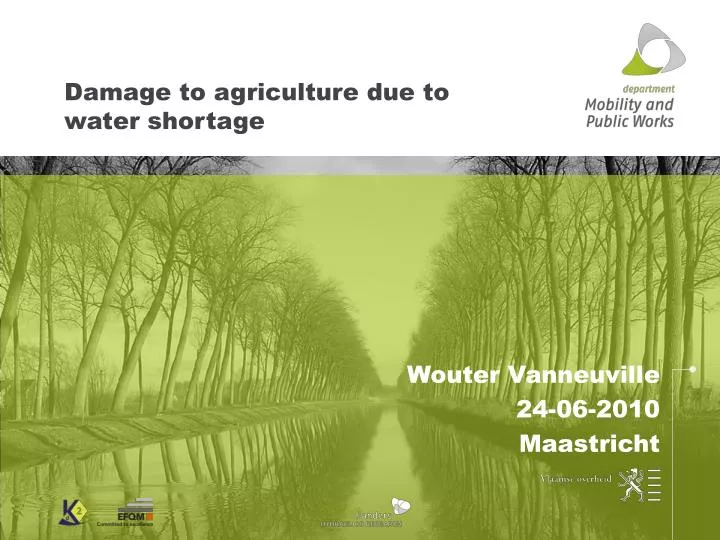
Damage to agriculture due to water shortage. Wouter Vanneuville 24-06-2010 Maastricht. Brief overview. Inventory of stakeholders Interviews Workshops Analysis of measures Social acceptance Quantitative analysis Cost-benefit analysis Low water strategy

E N D
Damage to agriculture due to water shortage • Wouter Vanneuville • 24-06-2010 • Maastricht
Brief overview • Inventory of stakeholders • Interviews • Workshops • Analysis of measures • Social acceptance • Quantitative analysis • Cost-benefit analysis • Low water strategy • Juridical and technical feasibility
Water chain Model instruments Water request 2002 shipping model agriculture model Qualitative Consequences (not able to quantify) damage model Water balance model Meteorological model Water supply 1976, 2003 Water system
Model instruments Water input in a 50% dry year
Model instruments • 9 strategies are worked out, based on: • Costs • Water savings • Need of different sectors • Different weightings • …
Water use by farm crops • Project done by “Bodemkundige Dienst van België” • Goal: estimation (time) of water demand (based on water gift) in agriculture (grassland, maize, wheats, potatoes, sugar beet, poplar, vegetables, fruit trees, ornamental plant cultivation and tree nursery) • Geographic: alongCampine canals, Albert canal (alsodone for Ghent area)
Gentse Kanaalzone Kempische zone Based on soil association map
Soil (Campine area) L: heavy clay, S: loamy sand
Soil • Moisture retention characteristics based on texture and average carbon grade • example: L (cultivation layer, Campine area) • Capilar subsequent delivery (Stikoba, based on texture)
Land use (areas, cultivation) • Recordings in manure database on parcel level (GIS) for most of the crops • Other based on NIS-data (tree nursery, ornamental plant cultivation) or separate data layers (forest) • Soil combinations (land use and soil association) • example: Maaseik(zone 5, in ha)
Rainfall • Reliable rainfall: expectable rainfall summation on a given day • Cultivation simulation over 46 years, check for typical years
Climatology: definition of typical years Based on 10-day values (correction for run-off and evaporation) >> Tuning of correction factors
Maximum moisture request • ETo x Kc = ETm (Kc : crop factors) • mostly: Kc = 1.2 (not for trees: Kc = 1) • Actual moisture demand (ETa) based on model simulations • Inputs: climatologic typical years (20% dry year, mediumyear) • Cultivation characteristics andsoil combinations
Water demand for irrigation and sprinkling • Distinction between intensive (most) and extensive (trees) agriculture • Based on several premises (e.g. sub-areas are historically hydromorph and independent of additional water input)