Download
1 / 2
20 likes | 175 Vues
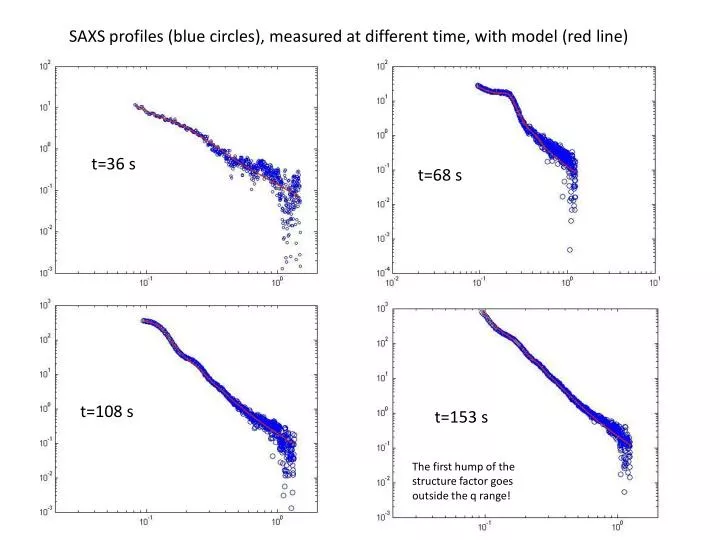
SAXS profiles ( blue circles ), measured at different time , with model ( red line ). t=36 s. t=68 s. t=108 s. t=153 s. The first hump of the structure factor goes outside the q range !. Data have been modelled by:. where:

E N D
SAXS profiles(bluecircles), measured at differenttime, withmodel (redline) t=36 s t=68 s t=108 s t=153 s The first humpof the structurefactorgoesoutside the q range!
Data have been modelled by: where: S(q,a,µ) is the Percus-Yevick structure factor for given inter-particles correlation distance a on a volume fraction µ, P(R) is the log-normal size (Rm) distribution Φ(qR) is the form factor of a single spherical particle. Furthermore, C is a scale factor, N is proportional to the scattering particles and the power law term A/qβ t=270 s Structurefactorisnownegligible…humps end up outside the q range!! The fitparameters are: A, b, CN, a, m, Rm, DRm