Download
1 / 46
460 likes | 630 Vues
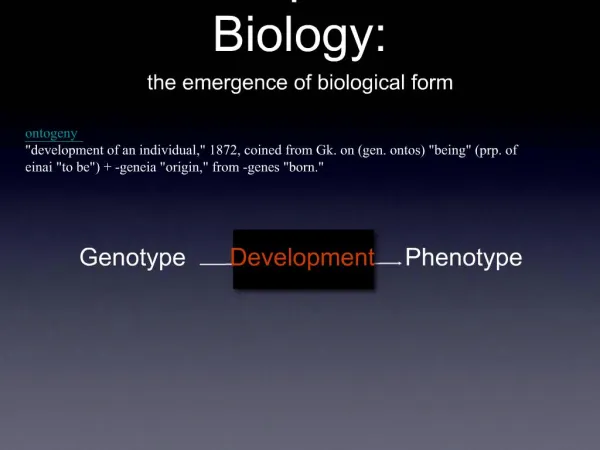
Proteomic Based Approaches In Developmental Biology. Why Proteomics?. Alterations between cells, tissues, and embryos often are not associated with changes in RNA levels, i.e. you cannot answer everything by RNA-seq; protein stability, protein localization, changes in PTMs, etc.

E N D
Why Proteomics? • Alterations between cells, tissues, and embryos often are not associated with changes in RNA levels, i.e. you cannot answer everything by RNA-seq; protein stability, protein localization, changes in PTMs, etc. • Only approximately 10% of all RNAs with changes of 1.5X or greater between two samples, from yeast to human, lead to a change of 1.5X in protein levels. • Establish in vivo interactomes as function of stage and tissue. • Define in vivo PTMs as function of stage and tissue.
Proteomic Based Approaches Proteomics Generally refers to a survey of all the proteins in a given tissue or cell type. Directed Proteomic The identification of a set of proteins that are in complex with a defined protein of interest. Quantitative Proteomics Characterization of the relative amount of a set of proteins between 2-16 samples.
1394.49 8000 7000 6000 1099.34 1252.42 5000 Abundance (Intensity) 861.24 1742.46 1584.48 4000 989.30 750.24 2846.95 3000 2522.78 1787.43 2000 1000 500 1000 1500 2000 2500 3000 (m/z) Mass Spectrometry – A Brief Definition Mass Spectrometry is a technique for the production of charged molecular species in vacuo, and their separation by magnetic and/or electric fields based on the mass to charge ratio (m/z).
Mass Spectrometry Data From Andrew Link, Vanderbilt University
Basic Mass Spectrometer From “Mass Spectrometry in Biotechnology by Gary Siuzdak
Fundamental Parts of a Mass Spectrometer Ion source Mass analyzer Detector 1. TOF 2. Ion trap 3. Quadrupole 4. Orbitrap 5. Magnetic sector 6. FTICR 1. MALDI 2. ESI
Ionization Techniques From “Mass Spectrometry in Biotechnology by Gary Siuzdak
Properties of Different Mass Analyzers
Ionization Steen and Mann, 2004
m/z Not Enough b-ion y-ion Verification of all proteins must be done by second phase MS to obtain sequence data of at least 3 peptides per protein O O O O C-NH-CH-C-NH-CH-C-NH-CH-C-NH-CH = = = = CH3 CH3 CH2-OH CH2-CH-(CH3)2 Peptide: SLAA
m/z Not Enough Verification of all proteins done by second phase MS to obtain sequence data of at least 3 peptides per protein. y-ion y-ion y-ion O O O O C-NH-CH-C-NH-CH-C-NH-CH-C-NH-CH = = = = CH3 CH3 CH2-OH CH2-CH-(CH3)2 Peptide: SLAA e.g. y-ion series=A, AA, LAA, SLAA
m/z Not Enough b-ion b-ion b-ion b-ion Verification of all proteins done by second phase MS to obtain sequence data of at least 3 peptides per protein. O O O O C-NH-CH-C-NH-CH-C-NH-CH-C-NH-CH = = = = CH3 CH3 CH2-OH CH2-CH-(CH3)2 Peptide: SLAA y-ion series= A, AA, LAA, SLAA b-ion series=S, SL, SLA, SLAA
TBX20 MS/MS Raw Data ~115D + H20 (16D) = 133D; i.e. Aspartic Acid ~115D
Protein Databases Database must contain what you need and little more: “Additional” proteins crashes specificity and discovery rate, increase shared tryptic peptides. Additional” proteins greatly(!) increase time of analysis. Need all available protein sequences from species of interest derived from trEMBL and SWISSPROT (Everything that is in NCBI, Sanger and EMBL).
Where Do Protein Sequences Come From? And How Do They Translate Gene Sequences? • All protein sequences in NCBI, etc. come from the UniProtDatabase which is divided into: • TrEMBL (automated annotation). Contains more redundancy, includes sequence fragments and isoforms. Especially useful for organisms that are not well annotated. • Swiss-Prot sequences (manually annotated). Sufficient for well-annotated organisms, e.g. human, mouse, yeast, E.coli, HSV-1 and Xenopus. This is not derived from the sequencing of proteins.
How do you know where your protein sequence came from? How do you know where your protein came from? Protein Entry Headers >SOURCE(sp/tr)|ACCESSION|UNIPROT_ID DESCRIPTION ORGANISM GENE >sp|Q04917|1433F_HUMAN 14-3-3 protein eta OS=Homo sapiens GN=YWHAH PE=1 SV=4 MGDREQLLQRARLAEQAERYDDMASAMKAVTELNEPLSNEDRNLLSVAYKNVVGARRSSWRVISSIEQKTMADGNEKKLEKVKAYREKIEKELETVCNDVLSLLDKFLIKNCNDFQYESKVFYLKMKGDYYRYLAEVASGEKKNSVVEASEAAYKEAFEISKEQMQPTHPIRLGLALNFSVFYYEIQNAPEQACLLAKQAFDDAIAELDTLNEDSYKDSTLIMQLLRDNLTLWTSDQQDE EAGEGN
Analysis with xProteo of Tbx20-GFP (MALDI)Source: 293 cells (Human Kidney Cell Line) False Positive Junk
Proteomic Based Approaches Proteomics Generally refers to a survey of all the proteins in a given tissue or cell type. Directed Proteomic The identification of a set of proteins that are in complex with a defined protein of interest. Quantitative Proteomics Characterization of the relative amount of a set of proteins between 2-16 samples.
Work Flow Can go from isolating tissue to trypsin in 1 day (a very long day) Incubation with Ab, 1hr at 4C. Takes another ~8hrs to wash, elute and concentrate (20ul)
Tissue Isolation Need Large/Unlimited Source of Protein for Initial Optimization e.g. TBX20: 293 Cells transfected with pcDNA 3.1-TBX20 CMV promoter driving epitope tagged Tbx20 Starting Material: N=15-20 X 150mm Dishes After Optimization: Current record from mouse of an endogenous protein 4fM (50 adult brains) Selimi et al. 2009 More likely: 500-1500 embryos Alternative: ES cell differentiation
Why so much? Each step needs to be optimized for an individual protein.
Initial Lysis Buffers Routinely Used Worked With TBX20
Which Epitopes or Tags • Ideal: High affinity, high specificity antibody against endogenous protein. • V5, Myc and Flg (1,3, 9X) Poor. Commercial Abs of too low affinity and/or low specificity. (V5 worked with Tbx20 but pulled down some non-specific proteins). 2. Anti-HIS (3, 6, 9X); i.e. Nickel or Cobalt Horrific. Very, very high non-specific interactions even in presence of DNAse. If it does work will probably strip off any interacting proteins. 4. HA (3X). Good. e.g. Bienvenu F. et al. 2010, 5. GFP. Better/Best but not an epitope tag and may interfere with protein function, e.g. Selimi et al. 2009 (worked with Tbx20). 6. AVI-Tag (In Progress)
Avi-tag Tagged Tbx20 Avi-tag epitope knocked into Tbx20 locus
Biotinylation by BirA Biotin Biotin Streptavidin Applications of BirA-mediated biotinylation Isolation and purification of small poplulations of cells from living embryos Purification of protein complexes Identification of Targets Genes, i.e.Chrommatin IP
AP Tagged Tbx20 Construct knocked into Tbx5 containing mouse for Tg
Proteomic Based Approaches Proteomics Generally refers to a survey of all the proteins in a given tissue or cell type. Directed Proteomic The identification of a set of proteins that are in complex with a defined protein of interest. Quantitative Proteomics Characterization of the relative amount of a set of proteins between 2-16 samples.
Overcomes the differential gel running problem. You can use software to quantitate
Best for separating whole cell lysate- looking at in tact proteins! You will lose Membrane proteins, histones, highly acidic proteins
MS-based Quantitative Methods • Precursor: Quantitation based on the relative intensities of extracted ion chromatograms (XICs) for precursors within a single data set. This is a widely used approach, which can be used with any chemistry that creates a precursor mass shift. For example, 18O, AQUA, ICAT, ICPL, Metabolic, SILAC, etc., etc. • Reporter: Quantitation based on the relative intensities of fragment peaks at fixed m/z values within an MS/MS spectrum. For example, iTRAQ and Tandem Mass Tags • Replicate: Label free quantitation based on the relative intensities of extracted ion chromatograms (XICs) for precursors in multiple data sets aligned using mass and elution time.
Stable Isotope Labeling Methods • ‘Mass difference’ approaches • Metabolic (Stable Isotope Labeling with Amino acids in Cell culture SILAC)- introduces heavy isotopes into sample • Chemical labels (Isotope Coding with Affinity tags ICAT) • Enzymatic (O16/O18 labeling) • Isobaric (equal mass) peptide tags • iTRAQ &TMT
SILAC Labeling Reagents • 13C- and 12C-Lysine(heavy – light = 6 D) • 13C- and 12C-Arginine(heavy – light = 6 D) C12->C13 adds oneneutronC13 is chemically indistinguishable
SILAC (98%) Prostate cancer cell line PC3 PC3M (low metastatic potential) PC3M-LN4 (high metastatic potential) Everley et al., MCP 2004
Labeling Efficiency of both isotopes Ratio = 0.98 Doublet is separated
You need to passage cells 3-4 times in heavy media, measure incorporation
Great Free On-line Resource: “The Expanding Role of Mass Spectrometry in Biotechnology by Gary Siuzdak