Download
1 / 100
1.04k likes | 1.27k Vues
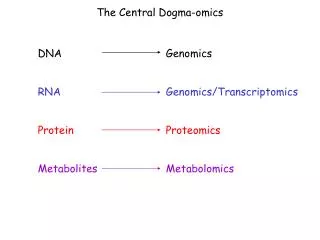
Experimental & Bioinformatic Tools for Proteomics. Steve Oliver Professor of Genomics Faculty of Life Sciences The University of Manchester http://www.cogeme.man.ac.uk http://www.bioinf.man.ac.uk. Functional Genomics. GENOME. TRANSCRIPTOME. PROTEOME. METABOLOME. Proteomics.

E N D
Experimental & Bioinformatic Tools for Proteomics Steve Oliver Professor of Genomics Faculty of Life Sciences The University of Manchester http://www.cogeme.man.ac.uk http://www.bioinf.man.ac.uk
GENOME TRANSCRIPTOME PROTEOME METABOLOME
Proteomics • Separation • Identification • Quantitation • Bioinformatics
Complex mixture analysis genome knowledge+ prediction peptide mass database “virtual” proteome post-translational modification Bioinformatics Identification real proteome separation methods 2D-gels, functional separations, n-dimensional chromatography [digest] complex mixtures & subsets complex peptide map fingerprint [digest] simple mixtures & single proteins simple peptide map fingerprint
Peptide mass fingerprinting denature KETAAAKFERQHMDSSTSAASSSNYCNQMMKSRNLTKDRC LPVNTFVHESLADVQAVCSQKNVACKNGQTNCYQSYSTMS ITDCRETGSSKYPNCAYKTTQANKHIIVACEGNPYVPVHF DASV digest (trypsin) KETAAAK FER QHMDSSTSAASSSNYCNQMMK SR NLTK DR CLPVNTFVHESLADVQAVCSQK NVACK NGQTNCYQSYSTMSITDCR ETGSSK YPNCAYKTTQANK HIIVACEGNPYVPVHFDASV m1 m2 m3 m4 m5 m6 m7 m8 m9 m10 m11 m12 mass spectrometry m12 m11 m7 m9 m10 abundance m1 mass
Proteomic applications • Quantitative Proteomics • “Expression” proteomics • protein levels under different conditions/times • Qualitative Proteomics • Identification proteomics • protein:protein interactions • post-translational modifications
“A MASS SPECTROMETER MEASURES THE MW….” “...A MS ANALYSIS GIVES THE MASS-TO-CHARGE RATIO (m/z) FOR IONS…IN GAS PHASE”. Brancia FL, Trieste, 12/02/2004
What is a “mass spectrometer”...? Brancia FL, Trieste, 12/02/2004
TOF, quadrupole, ion trap DIRECT INTRODUCTION (solid, liquid, gas) SEPARATION TECHNIQUES (HPLC, CE, GC) EI, FAB, MALDI,Electrospray Pumping system vacuum ION SOURCE (“ion generation”) ANALYZER (“mass analysis”) Sample introduction Detector Data Processing Brancia FL , Trieste, 12/02/2004
Various ionisation methods • Electron impact ionisation (1919 A.J. Dempster) • Chemical Ionisation CI • Fast atomic bombardment FAB (1981 M. Barber) • Matrix-assisted laser desorption ionisation MALDI (1988 K. Tanaka, M. Karas F. Hillenkamp) • Electrospray ES (1985, J. Fenn) Brancia FL, Trieste, 12/02/2004
‘Soft’ Ionisation Techniques ‘Soft’ refers to the low amount of energy imparted into the analyte during ionisation. Too much internal energy will result in fragmentation. Soft ionisation techniques form intact molecular or pseudo-molecular (M+H) ions. Matrix-assisted laser desorption ionisation (MALDI) Electrospray (ES) Brancia FL, Trieste, 12/02/2004
Nobel Prize in Chemistry 2002 “...for their developments of soft desorption ionisation methods for mass spectrometric analysis of biological macromolecules”. 1/4 to John B. Fenn (USA) Virginia Commonwealth University 1/4 to Koichi Tanaka (Japan) Shimadzu Corp. Kyoto Electrospray Ionization Laser Ionization 1//2 of the prize went to Kurt Wutrich (Switzerland) development of NMR analysis Brancia FL , Trieste, 12/02/2004
Electrospray (ES) Brancia FL, Trieste, 12/02/2004
[M+nH]n+ Droplet shrinks due to solvent evaporation Droplet explodes due to charge density limit Gaseous ions formed via one of two proposed mechanisms Brancia FL, Trieste, 12/02/2004
The principal outcome of the electrospray process is the transfer of analyte species, generally ionised in condensed phase, into the gas phase as isolated entities + + + + + + + + +HV + + + + + + + Aerosol of charged droplets Gaskell SJ Jounal of Mass Spectrometry 1997 Brancia FL, Trieste, 12/02/2004
ES spectrum of Rho protein Rho Protein: 47004.33 Da [M+56H]56+ [M+50H]50+ Courtesy of Dr Matt Openshaw Brancia FL, Trieste, 12/02/2004
Electrospray (ES)[M+56H]56+ = 840.3 m/zTherefore, M = [840.3 x 56] – 56 = 47000.8 DaDeconvolution: Takes all the multiply charged ions and converts them into a spectrum on a mass (Da) scale i.e. works out the molecular weight is most likely to be. Brancia FL, Trieste, 12/02/2004
ES spectrum after deconvolution 47004.0 Da Brancia FL, Trieste, 12/02/2004
Advantages • Production of molecular ions from solution • The ease of coupling with separation techniques (micro LC-MS/MSMS, nano LC-MS/MSMS) • Production of multiply charged ions Brancia FL, Trieste, 12/02/2004
Matrix Assisted Laser Desorption IonisationMALDI Time-of-Flight Brancia FL, Trieste, 12/02/2004
Matrix assisted laser desorption ionisation (MALDI) -cyano-4-hydroxycinnamic acid (CHCA) 2,5-dihydroxybenzoic acid (DHB) Trans-3,5-dimethoxy-4- hydroxy cinnamic acid (sinapinic acid; SA) Typically used with a nitrogen laser (337 nm) Brancia FL, Trieste, 12/02/2004
MALDI is an efficient desorption ionisation technique for producing gaseous ions from a solid sample by laser pulses [M+H]+ Brancia FL, Trieste, 12/02/2004
Matrix Assisted Laser Desorption/Ionisation (MALDI)Unlike ES, MALDI forms predominantly singly charged ions e.g. [M+H]+ or adducts (sodium [M+Na]+ or potassium [M+K]+) Sodium = 23 amu Potassium = 39 amu [M+H]+ [M+Na]+ 22 m/z [M+K]+ 38 m/z Brancia FL, Trieste, 12/02/2004
Why is the matrix so important? • Matrix is necessary to dilute and disperse the analyte • It functions as energy mediator for ionising the analyte itself or other neutral molecule • It forms an activated state produced by photo ionisation Brancia FL, Trieste, 12/02/2004
Advantages • MALDI primarily creates singly charged ions [M+H]+ • Less sensitive to contaminants • Sensitivity at femtomole level • High throughput analysis Brancia FL, Trieste, 12/02/2004
MALDI target Flight tube (field-free region) Detector Extraction grid t = 0 t = > 0 Time-of-flight (ToF) mass spectrometer mv2/2= zV t2=m/z(d2/2V) Brancia FL, Trieste, 12/02/2004
Reflectron-time of flight mass analyser Brancia FL, Trieste, 12/02/2004
MALDI ESI Sensitivity =femtomole 10-15 M/l (...attomole 10-18 M) Simplicity= very easy training required $$$= 70 to 650 k$ 120 to 650 k$ Speed (“high throughput”) = ~104/day dynamic system Selectivity(“resolution”) = >5000 Structural information = MSn MSn Software= “ ...evaluation in progress.” Brancia FL, Trieste, 12/02/2004
Structural information can be achieved by tandem mass spectrometry Brancia FL, Trieste, 12/02/2004
Ion source Analyser 1 Decomposition region Analyser 2 e.g. quadrupole e.g. quadrupole, time-of-flight collisionally activated decomposition CAD e.g. electrospray The tandem mass spectrometry experiment Brancia FL, Trieste, 12/02/2004
Collision gas molecules ion beam ion source ion detector m f f * f + + + + f 1 2 1 * + m f f + + + f + 1 m * 1 3 * + 2 f + f f * + + 3 f + 3 4 * 4 Collision Cell MS2 MS1 (a) (b) f f f 4 1 1 TIC f m TIC f m 3 3 f 2 m/z m/z Brancia FL, Trieste, 12/02/2004
PROBLEMS WITH ‘CLASSICAL’ • PROTEOME ANALYSIS: • Not comprehensive • 2. Not high-throughput • 3. Destroys protein-protein interactions • that provide important clues to function
Multidimensional protein identification technology (MudPIT) • Washburn MP, et alNat Biotechnol 2001, 19:242-247. SCX Reverse Phase Load complete digest of sample Develop with gradient and spray directly onto MSMS MS/MS Identified 1500 proteins from yeast including lower abundance species and membrane proteins 2415 (46%) of Plasmodium genome identified in all 4 stages of parasitic life cycle
Sidhu KS, Sangavich P, Brancia FL, Sullivan AG, Gaskell SJ, Wolkenhauer O, Oliver SG, Hubbard SJ (2001) Bioinformatic assessment of mass spectrometric chemical derivatisation techniques for proteome database searching. Proteomics 1, 1368-1377.
Provide limited sequence information by: • Identification of N-terminal amino acid by • PTC derivatisation • 2. Use guanidination to identify C-terminus, • determine lysine content, and improve • signal response • 3. Specifically fragment next to Asp residues using MALDI-QToF MS
PTC-derivatisation • phenylthiocarbamoyl derivative • Edman chemistry • N-terminal amino acid • b1 ion created via low energy collisions • precursor ion scan gives parents • increased sensitivity ms2 ms1 peptide ions scan for precursors fixed on b1 collision cell Spectra collected of all peptides which give rise to a given b1 ion (implying knowledge of the N-terminal amino acid)
Database peptide hits by N-terminal amino acid N-terminal mean number Error = ± 0.5 Da of peptides Amino acid ANY 74.15 W 1.70 Average number of matching proteins in the yeast proteome when searching with a peptide mass in the 1000-2000 Da range Rare amino acids give a bigger search gain C 1.77 H 2.30 M 3.41 : N 5.61 I 5.76 E 6.04 S 7.18 L 8.39 : I/L 14.16
Guanidation of Lysine H2N NH NH 2 NH NH2 O H3C NH2 NH 2 O O-methyl isourea NH 2 OH O OH lysine homoarginine
MALDI spectrum of an enolase tryptic digest R R R R R R K K K
6000 4000 *K 2000 0 800 800 1000 1000 1200 1200 1400 1400 1600 1600 1800 1800 2000 2000 2200 2200 2400 2400 2600 2600 Mass (m/z) Mass (m/z) MALDI spectrum of a tryptic digest of enolase after guanidation *K *K *K *K R *K R *K R *K R R *K *K
Initial set of search peptides and associated information Search database, compile protein “hit list” with matching peptides If all initial search peptides masses are matched, stop, else continue searching Top-scoring protein is matched. Remove corresponding peptides from search list
Real yeast proteomics • Alternatives to 2D-gels • denaturing technology • low abundance spots difficult to identify • Many steps of orthogonal 1D-steps • Size exclusion chromatography • Ion exchange chromatography • 1D-gels
Yeast proteome sample 1752.62 Before guanidination 3570.36 1768.59 795.32 1470.68 1708.61 811.32 800 1000 1200 1400 1600 3600 After guanidination R 1752.65 K 1512.69 K R 925.33 3612.77 1040.30 1210.39 1150.49 1416.55 1221.90 795.23 0 3600 800 1000 1200 1400 1600 1800 Mass (m/z)
Database search gains 1656 proteins match at least 1 peptide Standard MALDI 7 search peptides (before guanidination) 2549 proteins match at least 1 peptide Standard MALDI 12 search peptides (after guanidination) Combined 19 (7 + 12) search peptides (both experiments) 3235 proteins match at least 1 peptide
Database search gains # peptides in common Search peptides in common (5 from expt 1, 4 from expt 2) Only 289 proteins match at least 1 peptide in both experiments PTC derivatised 3 peptides N-term = Ile/Leu Only 204 proteins match at least 1 peptide All 3 sets of experimental data combined Only 18 proteins match at least 1 peptide in all 3 experiments