Download
1 / 35
350 likes | 547 Vues
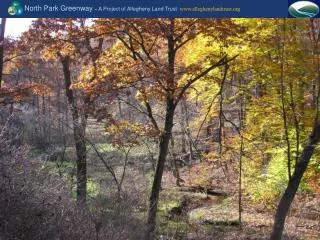
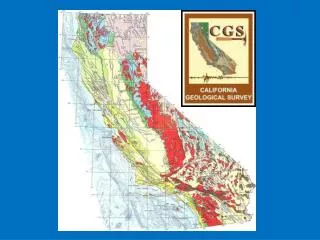
Constraints on the magnitude and timing of post-LGM thinning at Siple Dome from thermomechanical flow modeling. S. F. Price, H. Conway, E.D. Waddington Department of Earth and Space Sciences University of Washington R.A. Bindschadler NASA Goddard Space Flight Center. wais location map.

E N D
Constraints on the magnitude and timing of post-LGM thinning at Siple Dome from thermomechanical flow modeling S. F. Price, H. Conway, E.D. WaddingtonDepartment of Earth and Space SciencesUniversity of Washington R.A. BindschadlerNASA Goddard Space Flight Center
wais location map West Antarctica: Siple Dome (after Bindschadler and others, 1998)
SDM: pre- post- LGM graphic Motivation: How thick was WAIS over SDM during LGM? (Bindschadler, 1998)
SDM: pre- post- LGM graphic dH = ? dH/dt = ? Motivation: How thick was WAIS over SDM during LGM? (Bindschadler, 1998)
Goal and method Goal: constrain flow and thickness history of Siple Dome Method: (1) assume a known climate history over last 120 ka (Ts , b ) (Schilla and White, UC; Spencer and Alley; PSU) (2) model annual layers with different combinations of: (i) timing and magnitude of thinning (ii) timing of divide-flow initiation (iii) divide migration history (Nereson et al., 1988) (3) compare modeled annual layers with measurements: (i) depth-age scale from SDM ice core (Taylor et al., in press) (ii) internal layer shapes observed in RES (Conway et al., 1999) .
Method: previous talk, this talk Method: Previous talk Assuming a range of thickness histories, determine the range of accumulation rate histories that fit the observed depth-age scale This talk Assuming a known accumulation rate history, determine a range of thickness histories that fit the observed depth-age scale
Model description Flow Model: Finite Volume Method (FVM)1,2 • like FDM, uses structured grid (curvilinear, orthogonal grid) • like FEM, solves integral form of governing equations • full 2d stress balance • “flowband” formulation accounts for converging/diverging flow • non-steady, advective-diffusive heat balance in ice and bedrock • temperature dependent thermal properties • internal heat production • basal melting • explicit calculation of surface evolution • explicit tracking of internal layers BCs: specify flux at north/south sides of dome ( = balance flux + C ) 1Patankar, 1980; 2Versteeg and Malalasekera, 1995
FVM: divide flow validation Solutions for flow near a divide1,2 distance off divide in units of ice thickness e.g. 1Raymond, 1983; 2Hvidberg, 1996
SDM: Grid Siple Dome grid ISC ISD
SDM: radar layers internal layers (isochrons) observed in RES1 ISD ISC “Raymond Bump” Depth (m) 1400 1200 1000 800 600 400 200 0 -50 -40 -30 -20 -10 0 10 20 30 40 50 Distance from divide (km) 1Gades and others, 2000
SDM: modeled layers modeled internal layers ISD ISC
SDM: modeled layers modeled internal layers ISD ISC peak bump amplitude
SDM: modeld vs. measured d-a measured1 (grey) vs. modeled (color) depth-age scales (thinning is from 7-2 ka bp for all) a 1Taylor and others, in press
SDM: bump amplitude Bump Amplitude: modeled (color) (thinning is from 7-2 ka bp for all) observed
SDM: bump amplitude Bump Amplitude: modeled (color) vs. observed (black) (thinning is from 7-2 ka bp for all) observed
Ice fabric vs depth 1 (decreasing cone angle) (after Pettit, 2003; data courtesy of G. Lamorey, DRI)
Ice fabric vs depth 2 Holocene ice ice age ice recrystallized ice (decreasing cone angle) (after Pettit, 2003; data courtesy of G. Lamorey, DRI)
Ice fabric vs depth 3 “False Bed” ? ~200 m (after Pettit, 2003; data courtesy of G. Lamorey, DRI)
SDM: bump amplitude Bump Amplitude: modeled (color) vs. observed (black) (thinning is from 7-2 ka bp for all) observed shifted by 175 m (~200 m)
15 ka event 15 ka event
SDM: summary of results Summary Fitting the depth-age scale and the divide bump shape requires: • ~400-500 m of thinning since LGM • timing of thinning from ~7-2 ka bp • divide flow initiation at ~3 ka bp (w/ migration after 2 ka) • ~agreement with work of Waddington and others (in press) • 15 ka event has little affect if 1 ka in duration and/or b0.03 m a-1 .
SDM: summary of results Summary Fitting the depth-age scale and the divide bump shape requires: • ~400-500 m of thinning since LGM • timing of thinning from ~7-2 ka bp • divide flow initiation at ~3 ka bp (w/ migration after 2 ka) • ~agreement with work of Waddington and others (in press) • 15 ka event has little affect if 1 ka in duration and/or b0.03 m a-1 *** requires thinning of ~0.10 m a-1 for 5 ka *** .
SDM: map w/ ISD, ISC Cause for thinning of ~0.10 m a-1 from 7-2 ka bp? Evidence for LGM Ice Streams (after Bindschadler and others, 1998)
SDM: map w/ ISD, ISC Thinning from “enhanced” ice stream flow at dome flanks? (after Bindschadler and others, 1998)
SDM: map w/ ISD, ISC onsets at 7 ka bp (?) g.l. at 7 ka bp (after Bindschadler and others, 1998)
SDM: map w/ ISD, ISC Thinning at dome flanks as ice stream onsets migrate inland with grounding line? onsets after 7 ka bp (?) g.l. after 7ka bp (after Bindschadler and others, 1998)
Questions Questions Cause for ~500 m of thinning from 7-2 ka bp … - Increased in ice stream flow at the end of the LGM? - Inland migration of onsets as g.l. retreats? How long has Siple Dome been an interstream ridge? How long (and how low) was the accumulation anomaly at 15 ka?
SDM: temperature field ISD ISC
SDM: picked and modeled layers modeled (blue) vs. traced (red) internal layers
SDM: velocity fields ISD (north) ISC (south)
Conway et al map (Conway and others, 1999)