Download
1 / 14
150 likes | 289 Vues
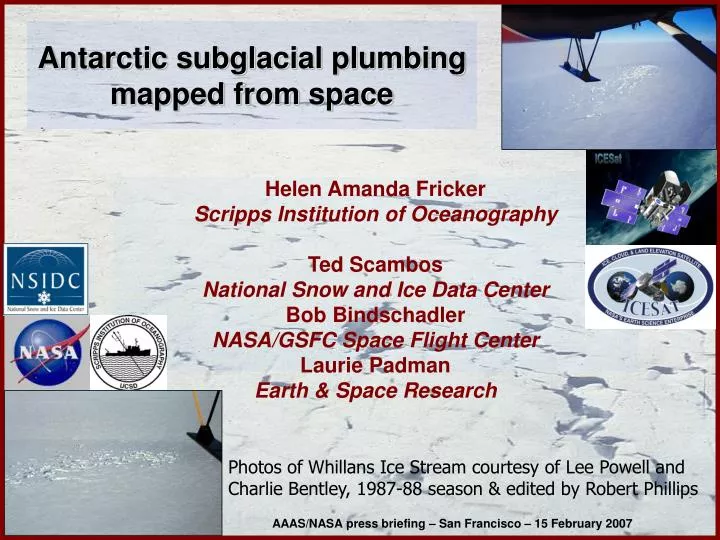
Antarctic subglacial plumbing mapped from space. Helen Amanda Fricker Scripps Institution of Oceanography Ted Scambos National Snow and Ice Data Center Bob Bindschadler NASA/GSFC Space Flight Center Laurie Padman Earth & Space Research.

E N D
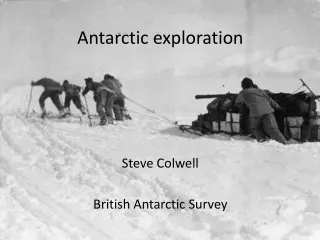
Antarctic subglacial plumbing mapped from space Helen Amanda Fricker Scripps Institution of Oceanography Ted Scambos National Snow and Ice Data Center Bob Bindschadler NASA/GSFC Space Flight Center Laurie Padman Earth & Space Research Photos of Whillans Ice Stream courtesy of Lee Powell and Charlie Bentley, 1987-88 season & edited by Robert Phillips AAAS/NASA press briefing – San Francisco – 15 February 2007
Helen Amanda Fricker Scripps Institution of Oceanography, La Jolla, CA AAAS/NASA press briefing – San Francisco – 15 February 2007
NASA’s ICESat mission and launch Ice Cloud and land Elevation Satellite (ICESat) launched 12 Jan 2003 from Vandenberg, CA Primary goal of ICESat mission is ice sheet change detection AAAS/NASA press briefing – San Francisco – 15 February 2007
ICESat laser altimeter Surface elevations along a ground track determined from laser time of flight, combined with precise orbit and pointing information ICESat has 3 lasers and is switched on for ~33 days every ~4 months in a repeat track pattern (which enabled this discovery) Geoscience Laser Altimeter System (GLAS) Schematic of single profile science data measurements, compiled through time to build elevation data sets AAAS/NASA press briefing – San Francisco – 15 February 2007
ICESat repeat-track analysis Elevation range 2003-06 (m) 0 9m Conway Ridge Mercer Ice Stream (A) Whillans Ice Stream (B) Engelhardt Ridge • + indicates surface uplift (filling) • indicates surface deflation (draining) • ~ indicates oscillating (i.e. doing both) MOA (NSIDC) AAAS/NASA press briefing – San Francisco – 15 February 2007
Largest event in magnitude: deflating ICESat elevation range (m) 0 9 Subglacial Lake Engelhardt Conway Ridge Mercer Ice Stream (A) Whillans Ice Stream (B) Engelhardt Ridge AAAS/NASA press briefing – San Francisco – 15 February 2007 WAIS Meeting 2006
Ted Scambos National Snow and Ice Data Center, Boulder, CO (by telephone) AAAS/NASA press briefing – San Francisco – 15 February 2007
Satellite image differencing Elevation range 2003-06 (m) 0 9m Conway Ridge Mercer Ice Stream (A) Uplift Whillans Ice Stream (B) Engelhardt Ridge Subsidence • + indicates surface uplift (filling) • indicates surface deflation (draining) • ~ indicates oscillating (i.e. doing both) MOA (NSIDC) AAAS/NASA press briefing – San Francisco – 15 February 2007
Hydraulic potential map Conway Ridge Mercer Ice Stream (A) Whillans Ice Stream (B) Engelhardt Ridge Elevation range 2003-06 (m) 0 9m Conway Ridge Mercer Ice Stream (A) Whillans Ice Stream (B) Engelhardt Ridge MOA (NSIDC) AAAS/NASA press briefing – San Francisco – 15 February 2007
Hydraulic potential map Conway Ridge SGL Mercer SGL Conway Engelhardt Ridge SGL Whillans SGL Engelhardt IMPORTANT: This is *not* topography AAAS/NASA press briefing – San Francisco – 15 February 2007
Subglacial Lake Engelhardt MODIS difference image: December 2005 minus December 2002 AAAS/NASA press briefing – San Francisco – 15 February 2007
Bob Bindschadler NASA Goddard Space Flight Center, Greenbelt, MD AAAS/NASA press briefing – San Francisco – 15 February 2007
Subglacial Lake Engelhardt Drawdown vs time at 3 crossovers Total volume loss ~ 2.0 km3 to ocean cavity under Ross Ice Shelf through subglacial channel AAAS/NASA press briefing – San Francisco – 15 February 2007
Conway Ridge Mercer Ice Stream (A) +1.2 km3 +0.27 km3 SgLW Whillans Ice Stream (B) Engelhardt Ridge -2.0 km3 How much water in the system? Elevation range 2003-06 (m) 0 9m • Isolated Subglacial Lake Engelhardt lost ~2.0 km3 over the observation period (33 months) SgLM +0.12 km3 SgLC • Remainder of the system had a net gain ~1.6 km3 over the same period (~0.6 km3a-1) • Net water gain is likely both reflecting and influencing the motion of these major Antarctic ice sheet outlet streams SgLE AAAS/NASA press briefing – San Francisco – 15 February 2007