Download
1 / 44
440 likes | 623 Vues
Spatial Indices of Upwelling. 1) Coastal Topography. Premise. Average spatial patterns of coastal ocean processes are strongly influenced by topography and bathymetry. How to quantify coastal topography?. ‘Coastal Anomaly’. Broitman and Kinlan 2006 MEPS, In press. Bays. Headlands.

E N D
Spatial Indices of Upwelling 1) Coastal Topography
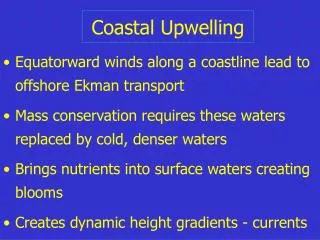
Premise • Average spatial patterns of coastal ocean processes are strongly influenced by topography and bathymetry
‘Coastal Anomaly’ Broitman and Kinlan 2006 MEPS, In press
Bays Headlands
COASTAL STRUCTURE -1.0 (Embayments) Along-coast Distance (km) Normalized residual from smoothed coast 0 (Headlands) +1.0 Scale of Smoothing (km)
COASTAL STRUCTURE Smoothing Scale=1000 km
COASTAL STRUCTURE Smoothing Scale=50 km
Coastal Topographic Index Chile WNA S. Africa
Cons Pros • Easily calculated • Data readily available • Arbitrarily high resolution • Can index processes at multiple scales • Indirect index; index of upwelling or any other process depends on nature of coupling • Not dynamic (no time component) • Oversimplified?
Spatial Indices of Upwelling 2) SST-derived indices
Coastal SST latitude time longitude
Correlation between Topo and dSST indices C) Topo vs. Δ SST
Spatial patterns of kelp and phytoplankton Areal cover Biomass
Spatial Cross-Correlations chl-a vs. kelp
Spatial Cross-Correlations A) Topo vs. kelp B) Topo vs. chl-a C) Topo vs. Δ SST
Alongcoast scales: Variogram Analysis Approximately the same characteristic scale
Variable Nugget (SE) Sill (SE) Range (SE) (km) Kelp 0.35 (0.09) 0.65 (0.09) 188 (100) Chl-a 0.13 (0.08) 0.87 (0.08) 178 (34) ΔSST† 0.008 (0.007) 0.992 (0.007) 151 (18) Coast Anomaly 0.04 (0.03) 0.96 (0.03) 161 (40) Alongcoast scales: Variogram Analysis
WNA 73 sites along 6000 km of coast South Africa 58 sites along 2000 km of coast Chile 26 sites 1000 km of coast
What scale of coastal features matter to the process you’re interested in? Correlation between variable of interest and topographic index at each smoothing scale
0.6 0.4 0.2 Cross-Correlation 0 -0.2 -25 -20 -15 -10 -5 0 5 10 15 20 25 Along-coast Lag Distance (km) Scale of pattern is just part of the question Peak @ 15 km in the poleward direction
Correlation with Coastal Anomaly – Mussels CHILE SOUTH AFRICA
Coastal Topography and Physical Forcing CHILE SOUTH AFRICA
Correlation with Coastal Anomaly: Mussels CHILE SOUTH AFRICA
Correlation with Coastal Anomaly: Trophic Grps SOUTH AFRICA CHILE
Long-term Average Recruitment vs. Topography at 21 Coastal Sites Green=Chthamalus Black=Balanus
Multiple regression with: Topo10km, Topo150km, Coastal Coordinate (linear latitudinal trend) Balanus r2=0.84, p<0.0001
Aside… Hierarchical Bayesian Modeling for Data Integration & Complex Hypothesis Testing
Site 1 Santa Barbara Site 2 Site 3 Site 4 Offshore Larval Pool Nearshore Ocean Offshore Ocean
Sea Temp (SST) Recruitment Santa Barbara Recruitment Current ChlorophyllA Recruitment Current Current Recruitment Current Offshore Larval Pool 16 points in time, each describing previous month Offshore Ocean Nearshore Ocean
i = space index , t = time index 2 TS=0 Onshore Delivery Offshore Larval Pool Combine these to get Recruitment Data: SSTt-TS Rit Git Rit~Poisson(FtHitei) Likelihood: i~N(0,2) Logit(Hit)= 0+1Git+g g~N(0,m2) Links: Ft = k + STS*SSTt-TS k,S 2 0, 1, m2 Parameters: N(0,10-3) vague IG(10-3,10-3) vague IG(2,10) informative N(0,10-3) vague Priors:
Chl , gate+errror, Gamma SST , gate+errror, Gamma SST , gate+errror, Poisson SST , gate+errror, Poisson, site effects