Download

1 / 22
240 likes | 663 Vues
Network Monitoring with Nagios and other tools. Wednesday, 19 July 2006 Martin B. Smith martins@bebr.ufl.edu. What is a network monitoring system?. A combination of hardware and software used to administer a network Common NMSes include:

E N D
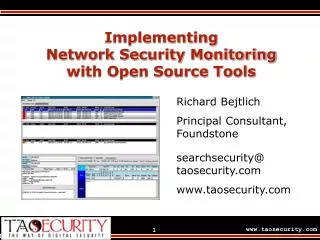
Network Monitoring with Nagios and other tools Wednesday, 19 July 2006 Martin B. Smith martins@bebr.ufl.edu
What is a network monitoring system? • A combination of hardware and software used to administer a network • Common NMSes include: Nagios, OpenNMS, HP OpenView, IBM Tivoli NetView, Microsoft Operations Manager, NAV • Protocols: SNMP, HTTP, SMTP/IMAP, SSH, or perhaps even WMI
Simple Network Management Protocol • For monitoring network-based devices • Extensible through Management Information Bases (MIBs) organized as hierarchical namespaces that define object identifiers and data types • Permits active (polling) or passive (interrupting) monitoring anywhere in the OSI 7 Layer model, though it operates at Layer 7 • Command line tools: snmpwalk, snmpset, snmptrap,snmpget,snmpinform, snmptranslate • Daemons: Snmpd, snmptrapd, syslog-ng, etc
Simple Network Management Protocol • 1988: Version 1; RFCs 1065, 1066, 1067 Clear-text community string! • 1993: Versions 2, 2c, 2u; RFCs 1441-1452, 1901-1910 Bulk requests, new complex security model • 2002: Version 3; IETF Recognized, RFCs 3411-3418 Security becomes user/view-based
Benefits and Problems with SNMP • Benefits: Standardized, simple & quick, relatively secure, high-end devices usually have built in support for it, autodiscovery • Problems: Index shifting, Not everything speaks SNMP or fits the model, requires a centralized or tiered architecture, MIBs are filed based, often a feature add, not very fault tolerant
Nagios • "NAH-gee-ohs" with a hard 'G' like geese • GPL v2, runs on Linux and Unix variants • Stable version 2.5, though many run 1.4.x • Originally called NetSaint, written in C • Configuration is file-based/template ready • Supports active and passive checks as well as distributed monitoring and failover
What advantages does Nagios have? • Plug-in system (!!) for writing a custom ‘check’ in any language you prefer • Intelligent scheduling and parallelization • Can tell apart down/unreachable checks • Automatic log file rotation, performance data processing, and a web interface! • Community and professional support • Integrates into SNMP and other solutions
Configuring Nagios • Configuration objects: Contacts, Hosts, Services, Commands, Events, Time Periods, Dependency, Escalation, and External Extended Information • Templates and Groups allow small configuration changes to drastically alter • Include external files and whole directories • Downtime, host/service notes, freshness
Contacts and contact groups define contact { contact_name root alias Root service_notification_period 24x7 host_notification_period 24x7 service_notification_options w,u,c,r host_notification_options d,r service_notification_commands notify-by-email host_notification_commands host-notify-by-email email root-notifications@bebr.ufl.edu } define contactgroup { contactgroup_name gatorlug-people alias GatorLUG People members clint,clint-phone,martin,barrys }
define timeperiod { timeperiod_name 24x7 alias 24 Hours A Day, 7 Days A Week sunday 00:00-24:00 monday 00:00-24:00 tuesday 00:00-24:00 wednesday 00:00-24:00 thursday 00:00-24:00 friday 00:00-24:00 saturday 00:00-24:00 } define timeperiod { timeperiod_name workhours alias Standard WorkHours monday 08:00-18:00 tuesday 08:00-18:00 wednesday 08:00-18:00 thursday 08:00-18:00 friday 08:00-18:00 } Time periods
define host { name generic-host notifications_enabled 1 event_handler_enabled 1 flap_detection_enabled 1 failure_prediction_enabled 1 process_perf_data 0 retain_status_information 1 retain_nonstatus_information 1 check_command check-host-alive max_check_attempts 10 notification_interval 0 notification_period 24x7 notification_options d,u,r contact_groups admins register 0 } define host { use generic-linux-host host_name gatorlug alias GatorLUG.org Server address 128.227.123.8 parents mat-router1 contact_groups gatorlug-people } define hostgroup { hostgroup_name networking alias Networking Devices members sur-switch1, sur-switch2, sur-switch3 } Template, Host, and a Hostgroup
define service{ name generic-service active_checks_enabled 1 passive_checks_enabled 1 parallelize_check 1 obsess_over_service 1 check_freshness 0 notifications_enabled 1 event_handler_enabled 1 flap_detection_enabled 1 failure_prediction_enabled 1 process_perf_data 0 retain_status_information 1 retain_nonstatus_information 1 notification_interval 0 is_volatile 0 check_period 24x7 normal_check_interval 5 retry_check_interval 1 max_check_attempts 4 notification_period 24x7 notification_options w,u,c,r contact_groups admins register 0 } define service{ hostgroup_name linux service_description Load process_perf_data 1 check_command check_nrpe!check_load!1.5,1.25,1 1.75,1.5,1.25 use generic-service } define service{ host_name gatorlug service_description Load process_perf_data 1 check_command check_nrpe!check_load!1.5,1.25,1 1.75,1.5,1.25 use generic-service contact_groups gatorlug-people } Service template and Services
Check commands # Service checks know these plugins as: check_mysql (no arguments) check_mysql_cmdlinecred!user!password # 'check_mysql' command definition define command{ command_name check_mysql command_line $USER1$/check_mysql -H $HOSTADDRESS$ } # 'check_mysql_cmdlinecred' command definition define command{ command_name check_mysql_cmdlinecred command_line $USER1$/check_mysql -H $HOSTADDRESS$ -u $ARG1$ -p $ARG2$ }
Creating check scripts • Simple scripts or C programs that return ('OK'=>0,'WARNING'=>1,'CRITICAL'=>2,'UNKNOWN'=>3,'DEPENDENT'=>4) or timeout • Nagios includes an ‘official’ suite of plugins that are entirely a separate project, on Sourceforge • Nagios plugin suite includes already-written checks for dhcp, dns, disks, smb, file_age, ftp, http, icmp, ifstatus, imap, jabber, ldap, load, log, mysql, ntp, windows, oracle, pgsql, rpc, radius, lmsensors, smtp, snmp, spop, sshd, ssmtp, tcp, time, udp, ups, users, waveform, negate
Events and notifications • Event handlers put a command into the command file (like the Web interface does), execute an external script, etc • Event handlers may try to ‘solve’ some problems head on, before they get worse or you respond • Notifications are really just check commands that send e-mail or notify you • Notifications will continue until you respond, and they will escalate until someone responds or status changes
The lifetime of a check • For active checks, Nagios runs your command and waits for a response or the timeout; For passive checks, Nagios does not act until the staleness limit is reached, and then it attempts an active check • If the check command returns OK or downtime is scheduled, mark that in the logs and continue, otherwise notify any listed contacts, execute any event handlers, eventually escalating • If the service changes status at all, notify contacts of new state, and treat if the new state is not OK, treat this as a new failed check and do it again
Downtime, Flapping, and Extended Information • Downtime can be scheduled and fixed or flexible; repetitive downtime is scheduled with cron and a plugin that inserts downtime commands into the cmd file • Services that change states with frequency above a certain threshold during a certain period are considered flapping, and notification is supressed temporarily • Extended information about hosts can be provided with config files or scripts and may provide links to the host itself, more information about the host, or anything else
Web interface and Data Visualization • Nagios also sports an elaborate web interface with CGI files that show status and can also issue commands • Nagios can be told to record and process performance data, and this data can be made available through graphing tools and extended information on the web interface
Perfdata and plugins • Plugins may return performance data after their normal output using a delimiter, and Nagios will periodically run a command to process this data • Popular perfdata plugins send performance data to RRDtool (Round-robin Database), the industry standard logging and graphing tool • Other perfdata scripts insert into databases or otherwise consume the information
Other utilities and NMSes • Web-based RRDtool frontend Cacti • OpenNMS, Java-based Enterprise SNMP • NAV, MRTG, and Netflow • SNMP Trap senders, translators, and MIB viewers/explorers • Could integrate all of these into Nagios!
Our Configuration • Secure HTTP with Apache2, LDAP authentication tied to network credentials • 35 hosts, 97 services, 18 host groups, 9 service groups • Devices types: Routers, Switches, Printers, UPSes, Servers • Service types: Software, temperature, load, disk space, HTTP response times, Voltage and power load, raid failures
The End • Slides and notes will be posted to the GatorLUG website, including URIs for software projects and pointers to reference material • Please don’t harass our Nagios-monitored boxes now that you’ve seen a list of them • Thank you!