Download
1 / 38
390 likes | 569 Vues
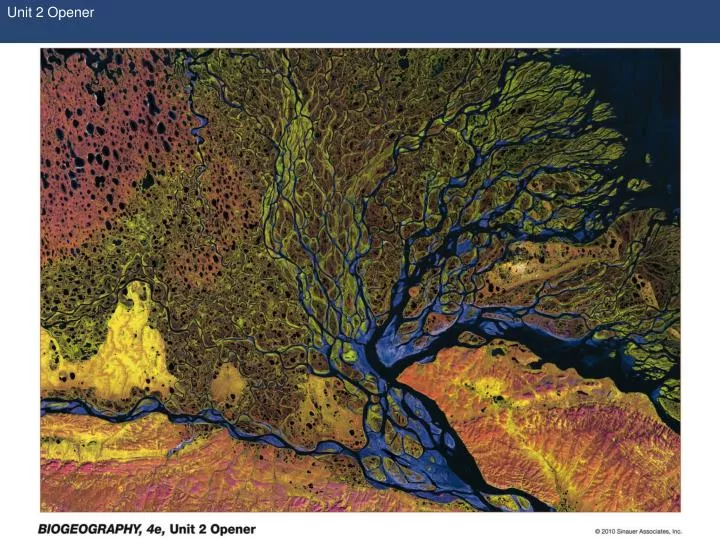
Unit 2 Opener. Figure 3.1 All biogeographic patterns are ultimately influenced by the geographic template. Figure 3.2 Average input of solar radiation to the Earth’s surface as a function of latitude.

E N D
Figure 3.1 All biogeographic patterns are ultimately influenced by the geographic template
Figure 3.2Average input of solar radiation to the Earth’s surface as a function of latitude
Figure 3.3 Seasonal variation in day length with latitude is due to the inclination of the Earth on its axis
Figure 3.3 Seasonal variation in day length with latitude is due to the inclination of the Earth on its axis (Part 1)
Figure 3.3 Seasonal variation in day length with latitude is due to the inclination of the Earth on its axis (Part 2)
Figure 3.4 Relationship between vertical circulation of the atmosphere and wind patterns on the Earth’s surface
Figure 3.5 Main patterns of circulation of the surface currents of the oceans
Figure 3.6 Major deserts of the world are not randomly distributed but tend to occur near 30° N or S latitude or along the leeward slopes of mountains
Figure 3.9 Representations of the four major pedogenic regimes showing the resulting soil profiles
Figure 3.9 Representations of the four major pedogenic regimes showing the resulting soil profiles (Part 1)
Figure 3.9 Representations of the four major pedogenic regimes showing the resulting soil profiles (Part 2)
Figure 3.10 Diagram depicting the relationships between major soil types and climate
Figure 3.12 The local elevational distribution of soil particle size and vegetation on a desert bajada on the Sonoran coast of the Gulf of California
Figure 3.13 Vertical temperature profiles of Lake Mendota, Wisconsin, at different dates from summer through winter showing the loss of thermal stratification as the lake cools
Figure 3.14 Local- to regional-scale spatial and temporal heterogeneity of surface waters in the North Atlantic Ocean is caused by meanders of the Gulf Stream
Figure 3.14 Local- to regional-scale spatial and temporal heterogeneity of surface waters in the North Atlantic Ocean is caused by meanders of the Gulf Stream (Part 1)
Figure 3.14 Local- to regional-scale spatial and temporal heterogeneity of surface waters in the North Atlantic Ocean is caused by meanders of the Gulf Stream (Part 2)
Figure 3.15 (A) Representation of how the centrifugal force of the spinning Earth and the gravitational force of the moon cause the tides. (B) Movement of surface waters in response to these tidal forces
Figure 3.16 A tide calendar for the northern Gulf of California showing the typical pattern of tides due to the gravitational influences of the moon and sun
Figure 3.17 Perhaps the first systematic, biogeographic map was the Carte Botanique de France, commissioned for the third edition of Flore Francaise (Lamarck and Candolle 1805)
Figure 3.18 Although map projections are created using various mathematical formulae, the basic approach is not difficult to understand
Figure 3.19 William Smith fundamentally transformed the way scientists viewed the world and the evolutionary dynamics of its rocks and life-forms
Figure 3.20 William Smith’s seminal map, A Delineation of the Strata of England and Wales with Parts of Scotland
Figure 3.21 Alexander von Humboldt’s landmark Tableau physique des Andes et pays voisins
Figure 3.22 The graphical equilibrium model, first sketched in a letter from Robert H. MacArthur to Edward O. Wilson in 1962, became one of the most compelling features of their theory of island biogeography
Figure 3.23 Since the first general accessibility to geographic information systems in the 1980s, their use has continued to accelerate
Figure 3.24 Cartograms utilize special projections to purposefully distort geographic units to emphasize geographic variation in characteristics of those units
Figure 3.24 Cartograms utilize special projections to purposefully distort geographic units to emphasize geographic variation in characteristics of those units (Part 1)
Figure 3.24 Cartograms utilize special projections to purposefully distort geographic units to emphasize geographic variation in characteristics of those units (Part 2)
Figure 3.24 Cartograms utilize special projections to purposefully distort geographic units to emphasize geographic variation in characteristics of those units (Part 3)