Download
1 / 21
210 likes | 347 Vues
CHEAPER AND CLEANER: Using the Clean Air Act to Sharply Reduce Carbon Pollution from Existing Power Plants, Delivering Health, Environmental and Economic Benefits March 2014 Update. CLOSING THE POWER PLANT CARBON POLLUTION LOOPHOLE: SMART WAYS THE CLEAN AIR ACT CAN CLEAN UP AMERICA’S

E N D
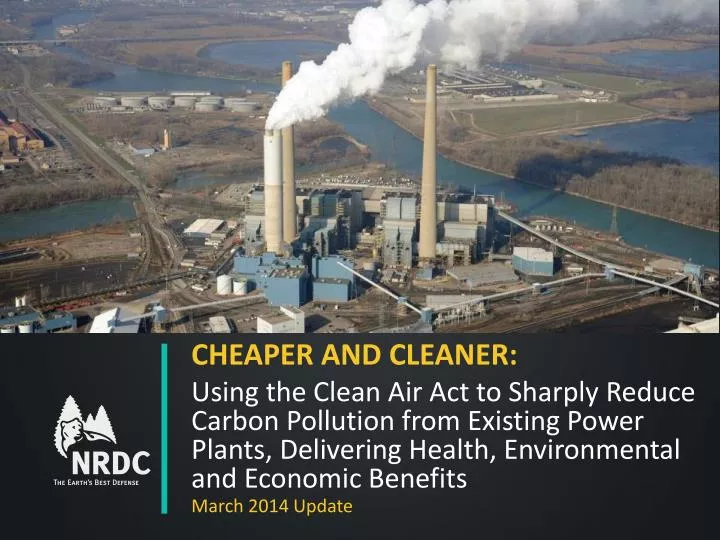
CHEAPER AND CLEANER: Using the Clean Air Act to Sharply Reduce Carbon Pollution from Existing Power Plants, Delivering Health, Environmental and Economic Benefits March 2014 Update
CLOSING THE POWER PLANT CARBON POLLUTION LOOPHOLE: SMART WAYS THE CLEAN AIR ACT CAN CLEAN UP AMERICA’S BIGGEST CLIMATE POLLUTERS “We limit the amount of toxic chemicals like mercury and sulfur and arsenic in our air or our water, but power plants can still dump unlimited amounts of carbon pollution into the air for free. That’s not right, that’s not safe, and it needs to stop.” -President Obama, June 25th, 2013
THE TIMELINE January 20th Start of President Obama's second term. June 25th President Obama announces Climate Action Plan. September 20th EPA proposes carbon pollution standards for future power plants. 2013 May 9th End of public comment period for future power plant proposal. June 1st EPA to propose guideline for carbon pollution standards for existing power plants. June-September Public comment period on existing power plant proposal. 2014 2015 June 1st EPA to finalize power plant carbon pollution standards. June 30th States to submit implementation plans for existing power plants to EPA. July-December EPA reviews state plans for compliance with its guideline. 2016 January 20th End of President Obama's second term. 2017
THE CLEAN AIR ACT AND EXISTING POWER PLANTS THE “101” ON 111 (d) EPA CO2 Emissions Guideline & State Plans • EPA proposes “emission guideline” June 2014, final June 2015. • Guideline includes performance standard and compliance provisions. • States have until June 2016 to adopt and submit state plans. If a state submits no plan, or one EPA cannot approve, EPA must issue a federal plan. “Best System of Emission Reduction” • “Source-based” approach limited to options plants can do “within the fenceline” (e.g. heat-rate improvements) – yields limited reductions, higher costs • “System-based” approach includes all options that reduce emissions –yields deeper reductions, lower costs • Heat-rate improvements • Shifting generation from coal to gas • Increasing zero -emission power (renewables and nuclear) • Increasing energy efficiency
NRDC PROPOSAL SYSTEM-BASED, STATE SPECIFIC STANDARDS State-specific fossil-fleet average CO2 emission rates (lbs/MWh) for 2020 and 2025 Calculatedby applying benchmark coal and gas rates to each state’s baseline (2008-2010) fossil generation mix Averagingallowed among all fossil units in state (including new units subject to the 111(b) standard) Credit for incremental renewables and energy efficiency (equivalent to adding MWhs to denominator in calculating emission rate for compliance purposes) States may opt in to interstate averaging or credit trading States may adoptalternative plans, including mass-based standards, provided they achieve equivalent emission reductions
STATES ALLOWED FLEXIBLE COMPLIANCE OPTIONS Heat rate reductions Cleaner power sources More renewables Investments in efficiency
NRDC SPECIFICATIONS LIST OF SCENARIOS Reference Case Moderate Case, Constrained Efficiency Moderate Case, Full Efficiency Ambitious Case, Constrained Efficiency Ambitious Case, Constrained Efficiency, PTC Ambitious Case, Full Efficiency
NRDC SPECIFICATIONS LIST OF SCENARIOS All Cases Efficiency Assumptions Ambition Assumptions • Full Efficiency Cases: 482 TWh available in 2020 (Synapse) • Constrained Efficiency Cases: 241 TWh available in 2020 • AEO 2013 demand projections • Onshore wind costs: DOE/LBL 2012 Wind Technologies Report • Nuclear units re-licensed
NRDC SPECIFICATIONS SIMPLE ENERGY EFFICIENCY SUPPLY CURVE Energy Efficiency Quantity Assumptions • Same energy efficiency potential (maximum MWhs saved) as in 2012 analysis • Divided evenly into three cost blocks in each region, 482 TWh in total Energy Efficiency Cost Assumptions • Costs apply nationwide, do not vary across regions • Derived based on utility program costs from Synapse and relative values from LBNL cost curve to estimate costs of each block • Middle cost block is equal to the Synapse utility program cost • Customer contribution at 45% of total cost is included in cost-benefit calculations
NRDC POLICY CASES vs REFERENCE CASE GENERATION MIX: 2012 vs. 2020 REFERENCE CASE 2020 Reference 2012 Actual
NRDC POLICY CASES vs REFERENCE CASE PROJECTED GENERATION MIX IN 2020
NRDC POLICY CASES vs REFERENCE CASE EMISSIONS 2014-2025 3,000 2,500 Reference Case Historical Moderate, Constrained Efficiency 2,000 Moderate, Full Efficiency CO2Emissions (short tons) Ambitious, Constrained Efficiency 1,500 Ambitious, Constrained Efficiency, PTC Ambitious, Full Efficiency 1,000 500 - 2005 2006 2007 2008 2009 2010 2011 2012 2013 2014 2015 2016 2017 2018 2019 2020 2021 2022 2023 2024 2025
NRDC POLICY CASES vs REFERENCE CASE EMISSIONS REDUCTIONS IN 2020: CO2 SO2 NOx
NRDC POLICY CASES vs REFERENCE CASE COSTS AND BENEFITS FROM REDUCED EMISSIONS IN 2020
STATE EMISSION RATE TRAJECTORIES UNDER NRDC POLICY AMBITIOUS CASES 2020 AND 2025
WESTERN REGIONAL RESULTS GENERATION MIX IN 2020
WESTERN REGIONAL RESULTS EMISSION REDUCTIONS IN 2020: CO2 SO2 NOx
PNW AND CA+OTHERWEST REGIONAL RESULTS CO2 CREDIT PRICES ($/Ton)
INTERSTATE ISSUES FOR CONSIDERATION Exporter states • Power leaves the state, emissions remain • States exporting to CA: emissions already counted under AB-32? Importerstates • Ability to select compliance pathways potentially limited by decisions in exporting states • Changes in out of state purchases reflected? • Out of state renewables and REC purchases? A multi-statecompliance agreement would allow each state to plan around utility portfolios, whether or not they cross state lines
HIGHER AND LOWER COST OPTIONS TO REACH THE SAME EMISSIONS LEVELS: NORTHWEST EXAMPLE The Northwest Power and Conservation Council analyze three pathways to ~35% emissions reductions by 2029 for the region, including imported power • $45/ton carbon tax: 14% revenue requirement increase • Cap and trade with free allocation: 2% revenue requirementincrease • Phased coal retirement: 15% revenue requirementincrease All scenariosincluded 5900 MW of additional Energy Efficiency
nlong@nrdc.org syeh@nrdc.org