Download
1 / 1
10 likes | 112 Vues
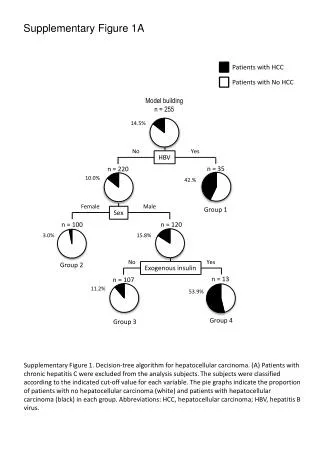
A. B. Gentile et al., Figure 1A. C. Gentile et al., Supplementary Figure 1

E N D
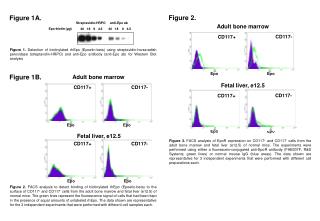
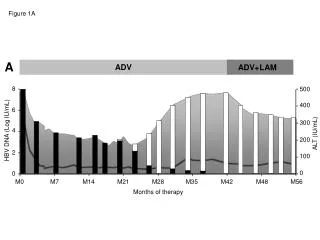
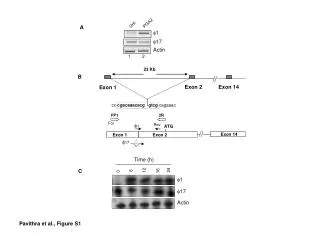
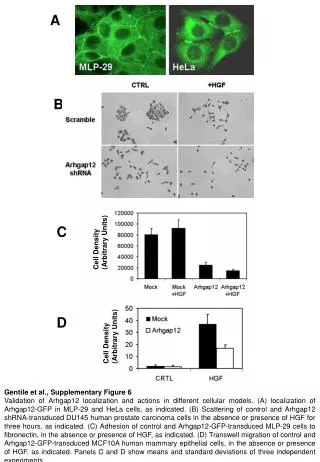
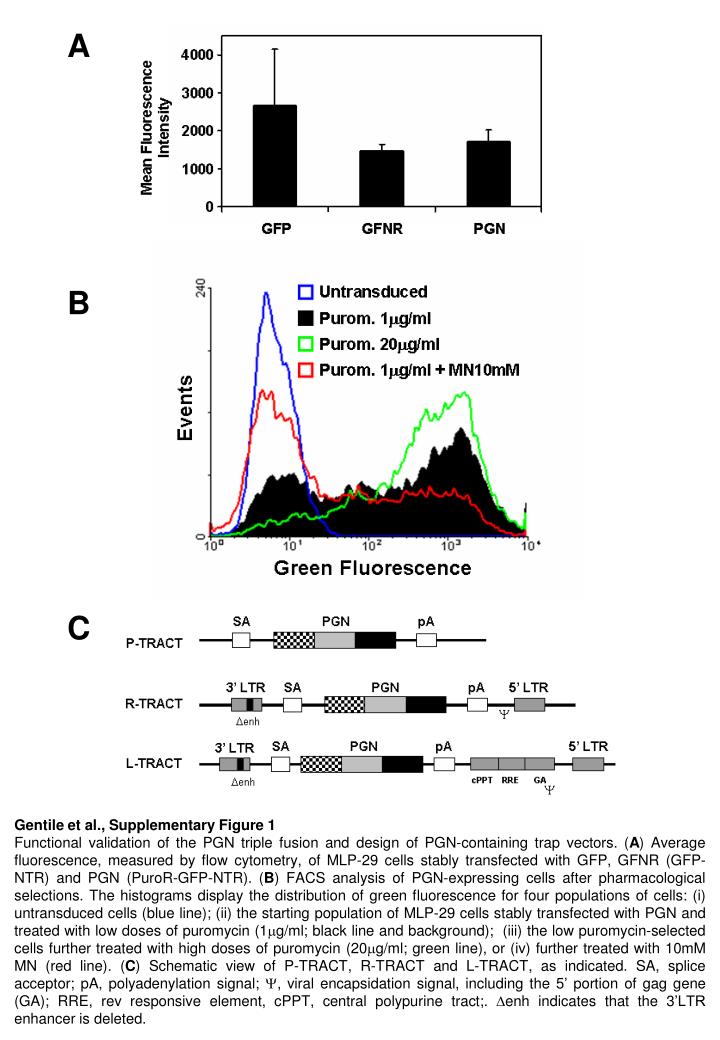
A B Gentile et al., Figure 1A C Gentile et al., Supplementary Figure 1 Functional validation of the PGN triple fusion and design of PGN-containing trap vectors. (A) Average fluorescence, measured by flow cytometry, of MLP-29 cells stably transfected with GFP, GFNR (GFP-NTR) and PGN (PuroR-GFP-NTR). (B) FACS analysis of PGN-expressing cells after pharmacological selections. The histograms display the distribution of green fluorescence for four populations of cells: (i) untransduced cells (blue line); (ii) the starting population of MLP-29 cells stably transfected with PGN and treated with low doses of puromycin (1g/ml; black line and background); (iii) the low puromycin-selected cells further treated with high doses of puromycin (20g/ml; green line), or (iv) further treated with 10mM MN (red line). (C) Schematic view of P-TRACT, R-TRACT and L-TRACT, as indicated. SA, splice acceptor; pA, polyadenylation signal; , viral encapsidation signal, including the 5’ portion of gag gene (GA); RRE, rev responsive element, cPPT, central polypurine tract;. enh indicates that the 3’LTR enhancer is deleted.