Download
1 / 20
240 likes | 382 Vues
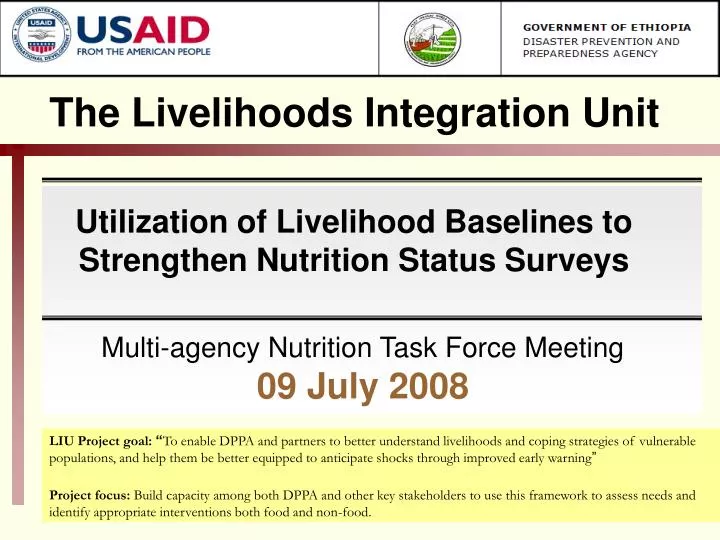
The Livelihoods Integration Unit. Utilization of Livelihood Baselines to Strengthen Nutrition Status Surveys. Multi-agency Nutrition Task Force Meeting 09 July 2008.

E N D
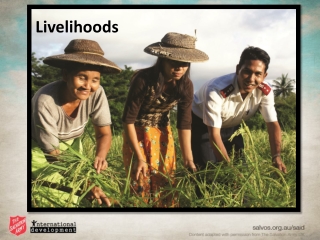
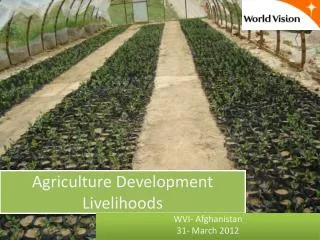
The Livelihoods Integration Unit Utilization of Livelihood Baselines to Strengthen Nutrition Status Surveys Multi-agency Nutrition Task Force Meeting 09 July 2008 LIU Project goal: “To enable DPPA and partners to better understand livelihoods and coping strategies of vulnerable populations, and help them be better equipped to anticipate shocks through improved early warning” Project focus: Build capacity among both DPPA and other key stakeholders to use this framework to assess needs and identify appropriate interventions both food and non-food.
Presentation Objectives • Introduce the household economy analytical framework • Introduce the livelihood zones- i.e. stratification as recommended by SMART • Demonstrate how seasonal calendars can identify appropriate time to assess nutritional status • Present examples of how the data can be used to interpret nutrition status data
HEA Framework: Overview HEA starts with an understanding of how households normally live….
HEA Framework: Overview …then it adds the impact of a shock….
Gap The analysis suggests that post-shock, households will not be able to maintain their normal livelihood assets without assistance. …and finally looks at how people might be able to cope. Livelihoods Protection Threshold Survival Threshold
In sum…. BASELINE
In sum…. + HAZARD BASELINE
In sum…. + + HAZARD COPING BASELINE
In sum…. + + = HAZARD OUTCOME COPING BASELINE
THE BASELINE Step 1 Step 2 Step 3 South Omo Pastoral Livelihood Zone Southern Agro-pastoral Eastern Oromiya
OUTCOME ANALYSIS Step 4 Step 5 Step 6 Problem Specification Herd size - camels 95% Herd size - cattle 85% Herd size - shoats 90% Milk production 50% Gifts of milk 50% Prices TOT Camels - 100% Cattle 80% Shoats 85% Prices Water - 200% Firewood/Charcoal 75% Compiled from data collected during seasonal assessments or monitoring or scenario development Data collected during baseline + + =
SMART LIVELIHOOD STRATIFICATION (Zoning) • As clearly mentioned in ‘Section 3: Food Security’ part of the SMART protocol, the following points need consideration that are related with the need for stratification • Seasonal variation in nutrition for interpreting nutrition surveys • How did people live before the event/shock? • What has affected to disrupted their way of life? • How are they currently coping? • What might reasonably be expected to occur in the near future? • The prediction for nutritional status to be based on • Reasonable knowledge of the livelihood pattern of the population • An understanding of the basic seasonality of agriculture and its associated activities • An estimation of the shock
WHAT IS LIVELIHOOD ZONE? Livelihood zone: • It is a geographical location within which people share basically the same pattern of access to food (i.e. the same production system as well as the same patterns of trade / exchange). • Llivelihoods can be shaped by a wide range offactors. Patterns of livelihood clearly vary from one area to another, according to local factors such as climate, soil, access to market, etc. • In order to simplify the process of defining livelihood zones, the initial focus is on the following three primary factors: GEOGRAPHY: natural and man-made PRODUCTION: Crop producers, pastorals, agro- pastorals, sources of food/ income MARKET: demand and supply, marketing system (for both goods and labor)
Sources of Food: 2003-04 Expenditure pattern: 2003-04 Sources of Cash Income: 2003-04 Wolayita Maize and Root Crop LZ Food access is expressed as a percentage of minimum food requirements ( 2100 kcals per person per day).
What can the HEA baselines tell us about Nutrition? Irob Mountains 225 ETB Non-staple food purchase is one possible indicator of dietary diversity Expenditure Patterns Raya Valley 978 ETB
% of food intake coming from purchase – poor % of food intake coming from purchase – very poor
Outcome Analysis for 2006 Dara Woreda (Sidama Zone) Sidama Coffee LZ Sources of Income Sources of Food Middle households Very poor households Very poor households • Very poor households in cash-cropping areas purchase most of their food. • A decline in cash income and an increase in maize prices means a bigger deficit in 2006 than 2004. Coffee prices increased to 215% Coffee production decreased to 70% Maize increase to 140% Livestock prices increased • Higher prices for coffee and livestock will increase incomes for middle households • A reduction in coffee production means less work and less income for the very poor (1 in 6 households). An ACF nutrition survey in June 2006 found the following high levels of malnutrition: GAM: 16.5 % (95% C.I. 12.5 - 20.5) of GAM SAM: 3.1 % (95% C.I. 1.4 - 4.8) of SAM. Five edema cases were identified. Source: ACF Nutrition and retrospective mortality survey, Sidama Coffee livelihood zone, Dale and Aleta Wondo Woredas, SNNPR, Ethiopia, June 2006