Download
1 / 47
470 likes | 475 Vues
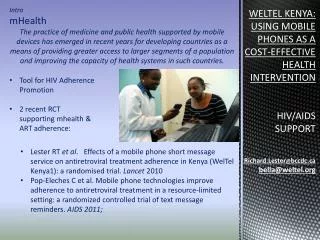
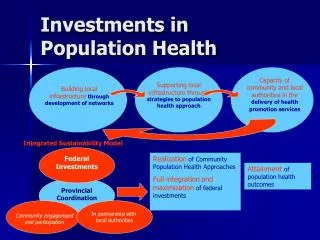
Developing CNS Capacity foR Population Health: A Strategy to Address national Health Needs. Sue Ellen Bell PHD, RN, PHN, APRN, CNS. What is a Population?.

E N D
Developing CNS Capacity foR Population Health: A Strategy to Address national Health Needs Sue Ellen Bell PHD, RN, PHN, APRN, CNS
What is a Population? • A population is defined as “a collection of individuals who have one or more personal or environmental characteristic in common” (Minnesota Department of Health [MDH], 2001, p. 2). • A population may consist of a group of individuals or families who share a common culture, ethnicity, language, values, or norms.
Vulnerability and Vulnerable Populations • A vulnerable population group (children, elderly, prisoners, persons with development disabilities, people living in poverty) is more likely to develop health problems when exposed to risk and to have worse outcomes from health problems • Vulnerable populations often have cumulative risks or combinations of risk factors. • Vulnerability implies that some groups are more sensitive to risk factors than others
What is Health? • The World Health Organization (WHO) defined health in its broader sense in its 1948 constitution as "a state of complete physical, mental, and social well-being and not merely the absence of disease or infirmity."
What is Population Health? • Population health, refers to “the health outcomes of a group of individuals, including the distribution of such outcomes within the group” (Kindig and Stoddart, 2003).
Population Health • Population health, the third component of the Triple Aim, along with improving quality and reducing healthcare cost, refers to “the health outcomes of a group of individuals, including the distribution of such outcomes within the group” (Kindig and Stoddart, 2003). It is more than the aggregate sum of individual attributed health outcomes and experiences.
Population health Paradigm • Integrated health promotion and chronic disease management • Collaboration between clinical, public health, and community services
Four Pillars of Population Health • Chronic care management • Quality and safety • Health policy • Public health
Department of Health and Human Services: HealthY People 2020 • Healthy People 2020 was designed to achieve four overarching goals: • 1. Attain high-quality, longer lives free of preventable disease, disability, injury, and premature death. • 2. Achieve health equity, eliminate disparities, and improve the health of all groups. • 3. Create social and physical environments that promote good health for all. • 4. Promote quality of life, healthy development, and healthy behaviors across all life stages (Healthy People 2020, 2011, para. 5).
What Are the Leading Health Indicators? • Access to health services • Clinical preventive services • Environmental quality • Injury and violence • Maternal, infant, and child health • Mental health • Nutrition, physical activity, and obesity • Oral health • Reproductive and sexual health • Social determinants • Substance abuse • Tobacco
HEALTH SPENDING (AS A PERCENT OF NATIONAL INCOME) AND LIFE EXPECTANCY AT BIRTH SELECTED HIGH-INCOME COUNTRIES
Indicators of Population Health • Life expectancy • associated with infant mortality • associated with socioeconomic status • individual or family income, • educational levels and professional status • the neighborhood where a family lives • the types of food they can afford to purchase • daily stress levels and the burden of stress over time • abilities to access health care services.
Additional Indicators of Population Health • Healthy life expectancy • Physical and mental healthy (unhealthy) days • Limitations on activity • Chronic disease prevalence (# reported by 1000 or 100,000) • International comparisons
Where Does the US Rank on Infant Mortality? • In 1960, the infant mortality rate in the U.S. ranked 12th among Office of Economic Cooperation and Development (OECD) countries. • By 2007, the rank of the U.S. had dropped to 28th among the 31 OECD countries, with only Chile, Mexico, and Turkey having higher rates of infant mortality (CDC, 2012). • In 2017, the U.S. estimated rank is 48th. Similar to Belarus, Lithuania, and Croatia.
MEDIAN HOUSEHOLD INCOME BY RACE/ETHNICITY, MINNESOTA 2015* • Population Group Income • Total $63,500 • Asian $72,300 • White $67,000 • Hispanic/Latino $43,400 • American Indian $36,900 • Black or African American $30,300 • Source: U.S. Census, American Community Survey, 2015 • In 2015 inflation-adjusted dollars • Hispanic/Latino can be any race *2016 median household income data will be released in December 2017.
Minnesota Data • From 2013 to 2014, the median income for black households in the state fell 14% ($31,500 to $27,000 or $4,500). • Statewide poverty rate for Black residents rose from 33% to 38%, compared to a stable overall state poverty rate of 11%. • The median Black household in Minnesota is now worse off than its counterpart in Mississippi. • Among the 50 states, Minnesota ranked 45th in median Black household income. Mississippi ranked 44th. • Income and poverty for other racial groups in Minnesota (whites, Hispanics and Asians) remained stable. Star Tribune September 17, 2015
Living in Poverty, 2015 • Population Percent MN U.S. • White 8.6 12.7 • Asian 16.4 12.6 • Hispanic/Latino 23.5 24.3 • American Indian 33.2 28.3 • Black or African American 35.6 27.0
IN MINNESOTA • People with higher incomes are more likely to: • Have good or excellent health • Live longer • Receive adequate prenatal care • Be insured • People with lower incomes are more likely to: • Have fair or poor health • Have an infant die in their first year of life • Have diabetes • Seriously consider suicide
Differences UNExplained? • National differences are NOT due to differences in medical science knowledge or application • Attributed to difference in medical choices made at the national level • Gap in wealth across groups; larger the gap, the more disparate the outcomes • Level of resources from public sources (e.g., universal insurance coverage) • Recommendations for use of interventions are evidence based and include analysis of what services should be purchased with allocated money to produce the best possible health for the population covered.
Relative Importance of Medical Care for the Public’s Health • Medical care provides 10% to 20% of the increase in population health • International comparisons show health is proportional to wealth (national GDP) • Health is not proportional to number of providers • More spending does not improve health, may even increase mortality rate • RAND Health Insurance Experiment • For people with generous insurance, many health care services may be wasted • For poor and chronically ill, free care improves health status
Contributors to health and health Care Expenditures Contribution to Health • 20% of health due to medical care • 20% due to genetics • 60% due to social, environmental, and behavioral factors Expenditures for Health • 90% health care delivery • 9% behavioral factors • 1% all other
Building on CNS Strengths • Big picture thinkers • Prepared to conduct data analysis and understand numbers • Use of Big Data to improve care • Practice is already defined as occurring in spheres of influence: Systems could easily be extended to include aggregates, communities, and overall population health
Potential for CNS practice • Community and public health • Transition of care from hospital to home • Cost-effectiveness analysis • Use influence to address social determinants of health within hospital setting (related to CMS mandate for community needs assessment) • Health literacy • Education
Opportunity costs: Cervical cancer screening by screening interval Role of Cost-Effectiveness Analysis Cervical Cancer Screening by Screening Interval
Relationship to Overall Population Health • Most countries outside the United States screen less frequently (every 3 to 5 years) for cervical cancer. • All spend less on health care and have higher life expectancies.
Best Practices in Behavioral Change • “The need to urge behavioral change is symptomatic of failure to establish contexts in which healthy choices are default actions. For example, counterbalances to our obesogenic environment include exhortations to increase physical activity and improve diet, which have little or no effect. More than one third of US adults, or 72 million people, were obese in 2006, a dramatic increase over 1980. Two thirds of these individuals were counseled by a health care provider to lose weight, yet daily calorie and fat intake continues to rise” (Frieden, 2010, p. 591).
Best Practices in Behavioral Change Continued • “Counseling, either within or outside the clinical context, is generally less effective than other interventions; successfully inducing individual behavioral change is the exception rather than the rule. For example, although clear, strong, and personalized smoking cessation advice, even in the absence of pharmacological treatment, doubles quit rates among smokers who want to stop and should be the norm in medical care, it still fails to help 90% of those who are motivated to quit” (Frieden, 2010, p. 591). Frieden, T. R. (2010). A framework for public health action American Journal of Public Health, 100(4), 590-595.
What Really Works? Less reliance on individual-level change to address social determinants of health. Redman, B. K. (2013). Advanced practice nursing ethics in chronic disease self- management. Springer.
Outcomes Research AND Determining What Really Works • Epidemiologic study of medical care • Data for analyses generated by everyday practice (e.g., from Medicare records, large system records) • Outcomes research • Consistent practice (guidelines and protocols) • New research on ICU outcomes in patients over 80 years of age
The Mandate for a APRN Role in Population Health • Integrate individual, family, and community interventions • Review the AACN definition of advanced practice nursing that includes population health outcomes and the Master’s/DNP Essentials that explicitly include the population-based focus of practice • Move away from silo thinking (“That is public health or “This stuff is not ‘real life’ nursing”) • Read the literature on health outcomes (“What is the unit of analysis.”) • Consider the continuum of care (outside the clinic or hospital) • Adapt “health in all policies” thinking • International (WHO): www.who.int/healthpromotion/frameworkforcountryaction/en/ • National (American Public Health Association): https://www.apha.org/~/.../health_inall_policies_guide_169pages.ashx • Work with an interdisciplinary team to create a comprehensive plan wherever your nursing career takes you
Sample Model of Care A commitment to social justice and health in all policies as fundamental to nursing practice Improved Overall Population Health Nursing actions at the aggregate, community, and societal levels
Measurement Strengths of CNS Practice • Improvement of care (QA/QI) • Accountability (measuring nurses’ contributions to outcomes) • Demonstrating that goals and objectives have been accomplished in project and program work • Research (local improvement of care and generalizable findings)
Areas of CNS Interest Geographic distribution of Health Spatial understanding of population health Distribution of disease within an area and across areas Environmental effect on health and disease Distribution of health care providers in relationship to distribution of disease Access and health care disparities
Building on a theme:Small Area Analysis • Large variations in practice style by geographical area • True of many medical conditions • More variation for conditions on which evidence for appropriate therapy exists • Sometimes more than one therapy may be appropriate • Providers may adjust behavior when informed of other providers’ practice patterns
Beyond the Field of Dreams Effect • Availability of services leads to more use of these services • More back surgeons, more back surgeries • More hospital beds, more hospitalizations • More hospital beds, more patients die in hospital • Evidence in some cases that financial considerations may affect medical decisions
Current Role of the Technology in addressing the distribution of Health • Recent resurgence of the geography of health and in 2000s is being applied to nursing • Geographic Information Systems (GIS) mapping • Cluster analysis of symptoms and attributes • Ethnic and cultural differences in disease prevalence (heart disease, cancers, diabetes, obesity) • Geographic distribution of cancers used to seek potential causes (environmental exposures) and identify possible protective behaviors (drinking red wine, drinking coffee, eating vegetables)
FOR A CLIENT IN RAMSEY COUNTY • Client • Address
Social Determinants of Health Effects of the Environment • Disparities in power and privilege • Medically underserved communities at disadvantage • Rural and urban/suburban differences • Disproportionately higher levels of exposure to environmental hazards in minority and low income communities
Behavioral Health Data for Better Health Promotion and Prevention • 1980s: Cluster analysis to see if there were patterns based on large dataset with limited variables (age, gender, hospitalizations, some comorbities, medications) in suicide • 2013 – 2015: VA looks at data to predict suicide among veterans (age, gender, deployments, PTSD and other diagnoses, medications, hospitalizations)
What are the implications of population health and Opportunities for the CNS? • How will you practice? • How will you teach? • How will you view the role of nurses? • What is the case for an improved society? • How would you create a new model of care for CNSs?
Adding Population Health thinking to CNS Practice • Make nursing practice without walls a reality • Patient education is an answer, not THE answer. • Cultivate a healthy sense of skepticism, especially when it comes to the cost of health care and the business of health care delivery. • Individual motivation can only go so far. • Nurses need to be educated to work in the future, but are generally trained to work in the present. • To be a change agent, you have to value change.