Download
1 / 71
710 likes | 713 Vues
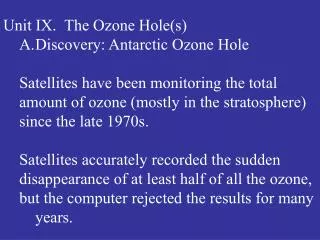
This study investigates the indirect effect of energetic particles on ozone in the Antarctic region using satellite measurements and numerical modeling. The inter-annual variability of ozone is analyzed in relation to solar and geomagnetic indices. Correlation analysis and sensitivity studies are performed to understand the ozone response to these indices.

E N D
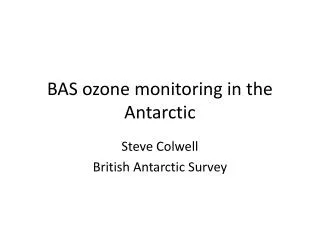
1 2 Inter-annual variability of Antarctic ozone T. Fytterer1, H. Nieder, M. Sinnhuber1, G. P. Stiller1, J. Urban2 • Scientific background • Data and methods • Results and discussion • Conclusions
Title page Scientific background Data and methods Results and discussion Conclusions • Energetic particles (e.g. electrons, protons) precipitate into the mesosphere and stratosphere between ~55° and 70°N/S, producing odd hydrogen (HOx=H+OH+HO2) and odd nitrogen (NOx=N+NO+NO2 , example) • NOx is long-lived during night (~days - months) can be transported downwards inside the polar vortex • Accumulated NOx in combination with solar radiation catalytically destroys O3 Assumption: Lower stratospheric O3 values are related to higher particle fluxes (example) Courtesy of NASA/Nasaimages.org Therefore our aim is:
Title page Scientific background Data and methods Results and discussion Conclusions Example for NOx production: N2 + e- → N2+ + 2e- N2+ + e- → N(2D) + N(4S) N(2D) + O2 → NO + O Example for catalytic O3 destruction: NO + O3 → NO2 + O2 NO2 + O → NO + O2 NO2 + O3 → NO3 + O2 NO3 + O → NO2 + O2 } net: O + O3 → 2O2 Solar radiation necessary for O production: O2 + hn→ O + O Up one level
Title page Scientific background Data and methods Results and discussion Conclusions Investigate indirect energetic particle effect on ozone in detail
Title page Scientific background Data and methods Results and discussion Conclusions (1): O3 observations • from satellite measurements (ENVISAT/MIPAS, Odin/SMR, TIMED/SABER) • including the complete data from 2002 – 2011 • inside the Antarctic polar vortex at altitudes ~20 – 70 km (2): Inter-annual O3 variability associated with • F10.7 cm solar radio flux (F10.7) • Lyman alpha hydrogen emission line (Ly-) • Ap index (Ap) • ≥2 MeV electron flux (2MeV) Data and methods
Title page Scientific background Data and methods Results and discussion Conclusions • Vortex estimation • Satellite/Instrument characteristics • Solar and geomagnetic indices • Analysis methods • Numerical modelling
Title page Scientific background Data and methods Results and discussion Conclusions • Antarctic vortex edge was estimated from potential vorticity (PV) gradient (calculated from ECMWF ERA-Interim data; Nash et al., 1996) • PV (K.m2/s-1.kg-1) was plotted against time and equivalent latitude (example for Antarctic winter 2011 at 40 km is shown below) • Vortex edge is defined as the equivalent latitude of largest PV gradient but: usually at least two locations of similar magnitude adding a visual analysis • Dividing the Southern Hemisphere into three zones: OUTSIDE (outside the vortex) EDGE (outermost edge) CORE (deep inside the vortex) • Three zones assured that features found in the EDGE region actually originating from the vortex • Individually determined limits of each zone and altitude hold for every winter from 2002 - 2011 Satellite/Instrument characteristics
Title page Scientific background Data and methods Results and discussion Conclusions Vortex estimation Solar and geomagnetic indices
Title page Scientific background Data and methods Results and discussion Conclusions Satellite/Instrument characteristics Analysis methods
Title page Scientific background Data and methods Results and discussion Conclusions • Correlation analysis between an index and ozone • Sensitivity of ozone to an index Solar and geomagnetic indices
Title page Scientific background Data and methods Results and discussion Conclusions Correlation analysis: • 26-day averages of an index (F10.7, Ly-, Ap, 2MeV) centered around 1 Apr, 1 May, 1 Jun • 26-day running means from 1 Apr – 1 Nov of O3 between 20 – 70 km inside the Antarctic vortex, minimising influence of the 27-day solar cycle • individually correlating each index with O3 of every height-time interval Example: Correlation analysis between 1 Apr Ap and O3 MIPAS observations from 10 Jul at 40 km Results from 2002 - 2011 Results during solar quiet time (2005 - 2010) Correlation coefficient (1 Apr Ap, O3) = -0.54 Up one level Sensitivity
Title page Scientific background Data and methods Results and discussion Conclusions Sensitivity: • 26-day O3 means of a certain height-time interval from 2005 – 2010 were plotted against a geomagnetic index (1 Apr Ap/2MeV) Next step Correlation coefficient = -0.43 Correlation analysis Numerical modelling
Title page Scientific background Data and methods Results and discussion Conclusions Sensitivity: • 26-day O3 means of a certain height-time interval from 2005 – 2010 were plotted against a geomagnetic index (1 Apr Ap/2MeV) • linear regression fit, arithmetic average of plotted O3 and index values Next step Correlation coefficient = -0.43 Correlation analysis Numerical modelling
Title page Scientific background Data and methods Results and discussion Conclusions Sensitivity: • 26-day O3 means of a certain height-time interval from 2005 – 2010 were plotted against a geomagnetic index (1 Apr Ap/2MeV) • linear regression fit, arithmetic average of plotted O3 and index values • sensitivity was calculated: dividing the gradient of a linear fit by ratio between the average of O3 and the average of the index Sensitivity results Correlation coefficient = -0.43 Correlation analysis Numerical modelling
Title page Scientific background Data and methods Results and discussion Conclusions Model configurations: • Simulation performed with a three-dimensional chemistry-transport model (3dCTM, Sinnhuber et al., 2012) • 3dCTM includes photochemical reactions and transport, driven by meteorological data from LIMA model (Berger 2008) • Model from 10 – 140 km on 47 pressure levels with latitude/longitude grid of 2.5° x 3.75° • Simulations with/without energetic particles from 2003 – 2009, both considering no solar cycle (F10.7 = 70 W/m²/Hz) • Ionisation rates from the Atmospheric Ionisation Module Osnabrück (Wissing and Kallenrode 2009), using simplified photoionisation Modelling results Sensitivity Results and discussion
Title page Scientific background Data and methods Results and discussion Conclusions • Ozone response to solar/geomagnetic indices • Correlation analysis 2002 - 2011 • Correlation analysis solar quiet time (2005 - 2010) • Sensitivity 2005 - 2010 • 3DCTM simulations: Ozone feedback to energetic particles
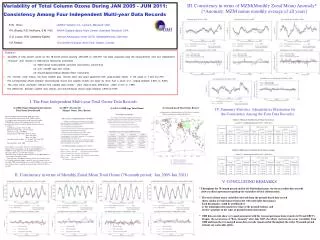
Title page Scientific background Data and methods Results and discussion Conclusions Correlation coefficients between 1 Apr Ap and MIPAS O3 observations inside the Antarctic polar vortex for 2002 - 2011. Framed areas show regions >95% significance level. Note: Similar results are obtained for correlations with an index centred around 1 May and 1 Jun Correlation analysis Further instruments
Title page Scientific background Data and methods Results and discussion Conclusions Correlation coefficients between 1 Apr Ap and O3 observations inside the Antarctic polar vortex for 2002 - 2011. Framed areas show regions >95% significance level. Correlation analysis Downwards propagating negative stratospheric O3 response indicated for 1 Apr Ap Results for 1 Apr 2MeV
Title page Scientific background Data and methods Results and discussion Conclusions Correlation coefficients between 1 Apr Ap/2MeV (upper/lower row) and O3 observations inside the Antarctic polar vortex for 2002 - 2011. Framed areas show regions >95% significance level. Correlation analysis Downwards propagating negative stratospheric O3 response indicated for 1 Apr Ap, visible for 1 Apr 2MeV Results for 1 Apr F10.7
Title page Scientific background Data and methods Results and discussion Conclusions Correlation coefficients between an index (Ap, 2MeV, F10.7) centred around 1 Apr and O3 observations inside the Antarctic polar vortex for 2002 - 2011. Framed areas show regions >95% significance level. Note: Similar results for F10.7 and Ly-a Correlation analysis Downwards propagating negative stratospheric O3 response indicated for 1 Apr Ap, visible for 1 Apr 2MeV, not clear for 1 Apr F10.7 Different impact associated with F10.7 and Ap/2MeV minimising direct solar impact
Title page Scientific background Data and methods Results and discussion Conclusions Only considering the years 2005 – 2010 which showed low solar activity (F10.7 ~70 – 85 W/m²/Hz) we obtained
Title page Scientific background Data and methods Results and discussion Conclusions Correlation coefficients between 1 Apr Ap and O3 observations inside the Antarctic polar vortex during low solar activity (2005 – 2010). Framed areas show regions >95% significance level. Well pronounced downwelling for 1 Apr Ap and 1 Apr 2MeV visible in all instruments • Similar O3 response to Ap/2MeV due to related source mechanism between Ap and 2MeV • Analysis for and region assure that the subsidence originates from vortex • NOTE: Structure is not robust, depends on individual years (Ap on 2009, 2MeV on 2010) Negative mesospheric Ap response in early winter due to HOx and local particle impact CORE OUTSIDE Correlation analysis Correlation results 2002 - 2011 Sensitivity results 2005 - 2010
Title page Scientific background Data and methods Results and discussion Conclusions Sensitivity (%/%) of O3 inside the Antarctic polar vortex associated with 1 Apr Ap/2MeV (upper/lower row) for 2005 - 2010. Strong sensitivity overlaps with high correlation coefficients supporting the observed downwelling • Magnitude of O3 response is larger by the factor of 2 for Ap compared to 2MeV Sensitivity Correlation results 2005 - 2010 3dCTM simulations results
Title page Scientific background Data and methods Results and discussion Conclusions • O3 difference (model run with energetic particles – base run) was divided by the arithmetic average of both runs • left panel shows the obtained relative O3 depletion, right panel the corresponding correlation coefficients with 1 Apr Ap. Framed areas show regions >95% significance level. Correlation coefficients in qualitative good agreement with measurements Relative O3 depletion of similar magnitude with observations of the sensitivity Numerical modelling Correlation results 2005 - 2010 Conclusions
Title page Scientific background Data and methods Results and discussion Conclusions We found: (1) a negative O3 response associated to 1 April Ap and 1 April 2MeV in all three instruments, propagating downwards inside the Antarctic polar vortex • magnitude of O3 feedback to Ap within the subsidence >20%, increasing 2MeV response by a factor of 2 (3) 3dCTM simulations are in good qualitative agreement with observed structures
Title page Scientific background Data and methods Results and discussion Conclusions Correspondence to: Tilo Fytterer (tilo.fytterer@kit.edu) Institute for Meteorology and Climate Research, Karlsruhe Institute of Technology, Hermann-von-Helmholtz-Platz 1, 76344 Eggenstein- Leopoldshafen, Germany
Title page Scientific background Data and methods Results and discussion Conclusions • Correlation coefficient between OH and O3 from 2005 – 2009 • OH from Microwave Limb Sounding onboard Aura, average (1 Apr – 31 May; 60 – 80 km) • O3 observed by MIPAS inside the Antarctic polar vortex → strong negative O3 response between 45 and 60 km in May and June → negative feedback at 35 km due to NOx, but visible due to similar source mechanism Up one level OH data from MLS team (http://mls.jpl.nasa.gov/)