Download
1 / 26
260 likes | 381 Vues
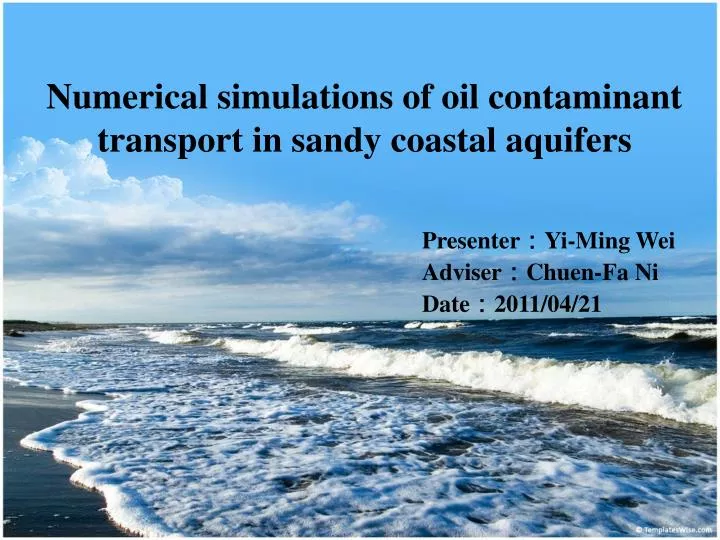
Numerical simulations of oil contaminant transport in sandy coastal aquifers. Presenter : Yi-Ming Wei Adviser : Chuen-Fa Ni Date : 2011/04/21. Outline. Motivation Objectives Methodology Test example Future work. Motivation. With the increasing developments of tourist and industrial

E N D
Numerical simulations of oil contaminant transport in sandy coastal aquifers Presenter:Yi-Ming Wei Adviser:Chuen-Fa Ni Date:2011/04/21
Outline • Motivation • Objectives • Methodology • Test example • Future work
Motivation • With the increasing developments of tourist and industrial estates in coastal area,different sources of contaminants can be discharged into the sea. • Marine pollution:Oil spills happen when people make mistakes or are careless andcause an oil tanker to leak oil into theocean.
Objectives • when a petroleum spill reaches the beaches, there may be deeper penetration in the soil, which depends on sand grain size, so causing serious damages to the ecosystem. • how much and how deep oil is transported into the beaches. • Whether oil polluted groundwater or not. (3)Other factor of influence oil transportation : tidal、wave、 beach slope、pumping well、recharge water …
Methodology-HYDROGEOCHEM-2D • Acoupled model of fluid flow, thermal transport, and • HYDROGEOCHEMical transport through saturated- • unsaturated media. • Deal with equilibrium and kinetic reaction in terms • of reaction networks. • Incorporate the effect of precipitation /dissolution • on the change of pore size, hydraulic conductivity, • and diffusion/dispersion.
Reactive Chemical Transport Equations The rate of mass accumulation The net rate of mass flux due to advection The net mass flux due to dispersion and diffusion, The source/sink term corresponding to artificial injection and/or withdrawal The rate of mass production and reduction due to chemical reactions and radioactive decay
Test example Pressure head = 85m Variable boundary condition Pressure head = 84m 100 m 400 m Impermeable bottom
Slope 1.0 mole/liter ( C6H6) Beach slope = 0.2、0.3 Pressure head = 85m Pressure head = 84m No rainfall 100 m 400 m Impermeable bottom
Total head Beach slope = 0.2 Beach slope = 0.3
12day Beach slope = 0.2 Beach slope = 0.3
27day Beach slope = 0.2 Beach slope = 0.3
46day Beach slope = 0.2 Beach slope = 0.3
Recharge I= 0.01m/day Beach slope = 0.2 Pressure head = 85m Pressure head = 84m 100 m 400 m Impermeable bottom 1.0 mole/liter ( C6H6)
Total head No rainfall I= 0.01m/day
27day No rainfall I= 0.01m/day
Pumping well 1.0 mole/liter ( C6H6) Beach slope = 0.2 Pressure head = 85m Pressure head = 84m No rainfall 100 m 400 m Impermeable bottom -20 m2/day(抽水)
Total head no pumping well pumping well
27day no pumping well pumping well
46day no pumping well pumping well