Download
1 / 21
210 likes | 338 Vues
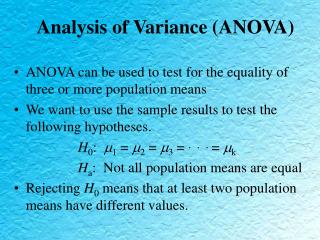
Analysis of variance (3). Measurements (data). Descriptive statistics. Data transformation. Normality Check Frequency histogram (Skewness & Kurtosis) Probability plot, K-S test. YES. NO. Mean, SD, SEM, 95% confidence interval. Median, range, Q1 and Q3.

E N D
Measurements (data) Descriptive statistics Data transformation Normality Check Frequency histogram (Skewness & Kurtosis) Probability plot, K-S test YES NO Mean, SD, SEM, 95% confidence interval Median, range, Q1 and Q3 Non-parametric 2-way ANOVA with replication Data transformation e.g. Fmax test Check the Homogeneity of Variance Non-Parametric Test(s) For 2 samples: Mann-Whitney For 2-paired samples: Wilcoxon For >2 samples: Kruskal-Wallis Sheirer-Ray-Hare NO Multi-way ANOVA (Ch 14) Nested ANOVA (Ch 15) YES Friedman p. 263-265 Parametric Tests Student’s t tests for 2 samples; ANOVA for 2 samples; post hoc tests for multiple comparison of means Non-parametric Repeated-measures ANOVA Univariate ANOVA Only one dependent variable
Multi-way ANOVAEffects of sex and water temperature on the oxygen consumption rate of three species of inter-tidal crabs
Multi-way ANOVA • e.g. We would like to investigate the effects of sex and temperature (10, 20, 30C) on oxygen consumption rate (OC; mg O2/hr/individual) of three different species of crabs of similar size • Dependent variable = OC • 3-Factors = Species (3 levels), Sex (2 levels) and Temperature (3 levels) • 4 Replicates per group (balanced design), thus • Total N = 3 x 2 x 3 x 4 = 72
The oxygen consumption rate (mg O2/hr/individual) of the crabs
Species A Species B Species C
Data input in SPSS • Column 1 (Species): 1, 2, 3 • Column 2 (Temp): 1, 2, 3 • Column 3 (Sex): 1, 2 • Column 4 (OC): dependent variable • Model or effects in hypothesis: • Species • Temp • Sex • Species Temp • Species Sex • Temp Sex • Species Temp Sex
How to obtain the DF? Computer Output There is no critical values in Table B4 for d.f. = 54, so the values for the next lower d.f. = 50 were utilized.
Computer Output In conclusion, the oxygen consumption rates (OCR) of the three species are not the same; and OCR increase with temperate. Furthermore, OCR of a species is dependent on temperature and sex as indicated by the significant interactions.
Species A Species B Species C Remember to double check your ANOVA results against the figures!
Exercises– Please try to do these exercises at home or on this coming Computer lab • Chapter 14 (Zar 1999) • Page 301-2: Questions 14.4, 14.5 and 14.6
Nested (Hierarchical) ANOVAChapter 15 • In some experimental designs, we may have • some levels of one factor occurring in combination with the levels of one or more other factors, and other distinctly different levels occurring in combination with others. • e.g. testing the influence of drugs (3 types) on the blood cholesterol level in women while the drugs are produced by different sources (2 company)
Nested (Hierarchical) ANOVA • e.g. testing the influence of drugs (3 types) on the blood cholesterol level in women while the drugs are originated from different sources • Each drug obtained from 2 sources but the 2 sources were different for all the drugs • Two factors: drug type and drug source • Nested design: with one factor (drug source) being nested within the major factor (drug type)
Test Ho: Same blood cholesterol concentrations Drug X Drug Y Drug Z • The nested factor is typically random (as this example) • This example may be considered to be a kind of one-way ANOVA, however, a different denominator (i.e. not the error MS), subgroups MS, must be used to calculate the F value for the main factor (i.e. drug type). Source A B C D E F
C = (1270)2/12 = 134408.33 Total SS = 134480 - 134408.33 = 71.67 Among all subgroups SS = 134471 - 134408.33 = 62.67 Error SS = Total SS – among all subgroups SS = 71.67 – 62.67 = 9.00 Groups SS = 134469.5 – 134408.33 = 61.17 Subgroups SS = among all subgroups SS – groups SS = 62.67 =61.17 = 1.50
a = 3 [3 drugs] b = 2 [2 sources] Total DF = N - 1 = 12 – 1 = 11 Among all subgroups DF = ab –1 = (3)(2) – 1 = 5 Error DF = Total – among all subgroups = 11 –5 = 6 Groups SS = 3 – 1 = 2 Subgroups SS = a(b-1) = 3(2-1) = 3 Using subgroups MS as the denominator In conclusion, (1) there is no significant difference among the drug sources in affecting blood cholesterol concentrations (F0.05(1), 3, 6 = 4.76, P > 0.5) ; and (2) there is significant difference in cholesterol concentrations owing to the three drugs (F0.05(1), 2, 3 = 9.55, P < 0.01).
Example 15.2 (p. 309; Zar 1999)ANOVA with a random-effects factor (blood collection) nested within the two-factor crossed experimental design • Effects of sex and hormone treatment on plasma calcium concentrations (mg/ 100 ml) of birds: • For each of the 4 combinations of sex and hormone treatment (a = 2 & b =2), there are 5 animals (c = 5), from each of which three blood collections are taken (n = 3). • N = abcn = 60
Example 15.2 (p. 309, Zar, 1999)ANOVA with a random-effects factor (blood collection) nested within the two-factor crossed experimental design
Exercise • In an experiment on cholesterol level in blood of mice two levels of fat intake are fixed by the researchers and coded as level 0 and 1. For each level of intake, there are three populations of mice in separate cages and from each of these individual mice are selected at random for blood testing.