1 / 1

TR PR TL PL BL BP

-6. 0. +6. Log(Ratio). TR PR TL PL BL BP .

garret
Télécharger la présentation

TR PR TL PL BL BP

An Image/Link below is provided (as is) to download presentation Download Policy: Content on the Website is provided to you AS IS for your information and personal use and may not be sold / licensed / shared on other websites without getting consent from its author. Content is provided to you AS IS for your information and personal use only. Download presentation by click this link. While downloading, if for some reason you are not able to download a presentation, the publisher may have deleted the file from their server. During download, if you can't get a presentation, the file might be deleted by the publisher.

E N D

Presentation Transcript


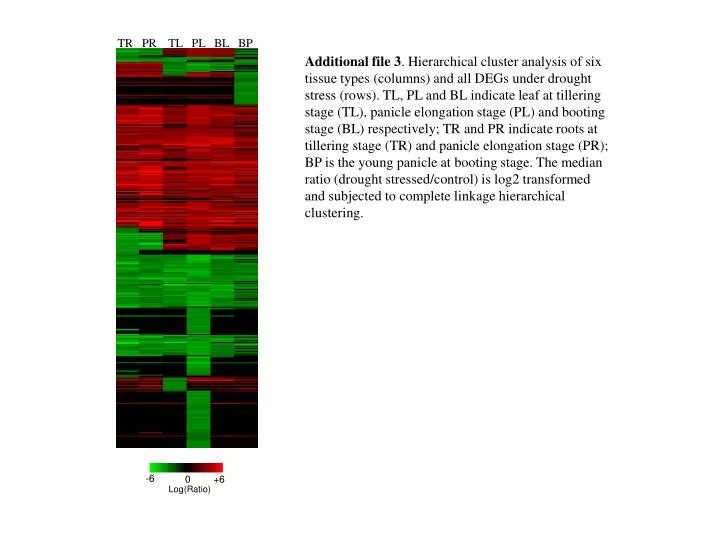
  1. -6 0 +6 Log(Ratio) TR PR TL PL BL BP Additional file 3. Hierarchical cluster analysis of six tissue types (columns) and all DEGs under drought stress (rows). TL, PL and BL indicate leaf at tillering stage (TL), panicle elongation stage (PL) and booting stage (BL) respectively; TR and PR indicate roots at tillering stage (TR) and panicle elongation stage (PR); BP is the young panicle at booting stage. The median ratio (drought stressed/control) is log2 transformed and subjected to complete linkage hierarchical clustering.

More Related