Download
1 / 11
110 likes | 283 Vues
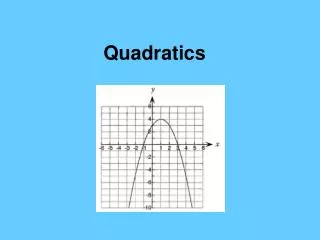
All About A Bounce Act I: Quadratics. A Kern High School District Task. In this task, we will model the motion of a ball bounce. I. Before The Bounce Sketch what the path of the ball will look like. Make a list of all the things you know about this shape?. Instructions.

E N D
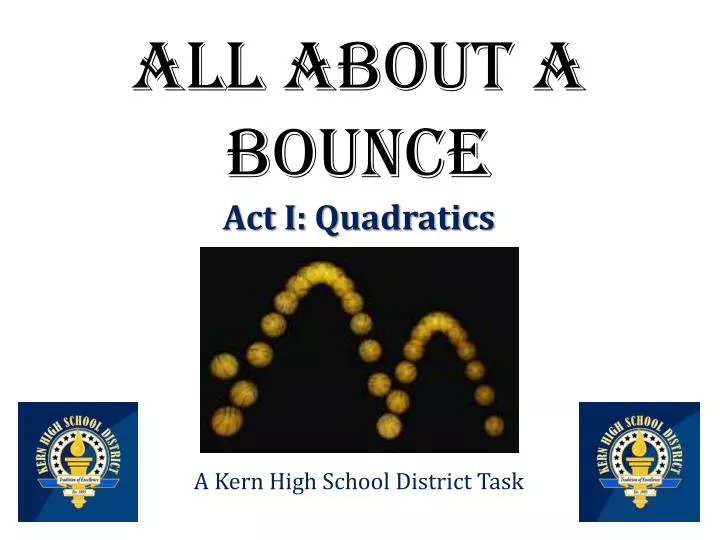
All About A BounceAct I: Quadratics A Kern High School District Task
In this task, we will model the motion of a ball bounce. I. Before The Bounce • Sketch what the path of the ball will look like. • Make a list of all the things you know about this shape?
Instructions • To do this we will need 5-7volunteers. • Each participant will line up at premeasured intervals in front of the board within arm’s reach. • Each participant will mark where the ball passes in front of them. • The rest of the class will accept or reject the data
II. After the Bounce • How high did the ball bounce? b. How far horizontally did the ball bounce?
III. Measure and Record the Data Measure the height of each data point. Then plot the points on your graph.
IV. Estimates a. Estimate where the ball hit the ground. Explain b. Estimate how far the ball traveled horizontally. Explain c. Estimate the maximum height reached by the ball. Explain
V. Use technology to find a best fit graph. Record the equation of best fit:_____ According to your model of best fit, where did the ball hit the ground? How far did the ball travel horizontally?
What was the maximum height reached by the ball? How does the answer compare to you estimate? e. How far did the ball travel horizontally while it was at or above 2.5 feet?
VI. Compare the equation to your answers in V. What important information does the equation provide?
VII. Additional Analysis • If the equation had a positive value for the leading coefficient what affect would it have on the graph? Would that make sense for this scenario? Explain
b. Draw three ball bounces that hit the ground at the same two points. How are your graphs the same and how are they different?