Download
1 / 2
20 likes | 140 Vues
Assignment. Answer the recitation’s question, for example “what is the correlation between education and GDP per capita?” using one powerpoint slide. On this slide, insert: Your choice of response and explanatory variable. The scatter plot. The mean, standard deviation of each variable.

E N D
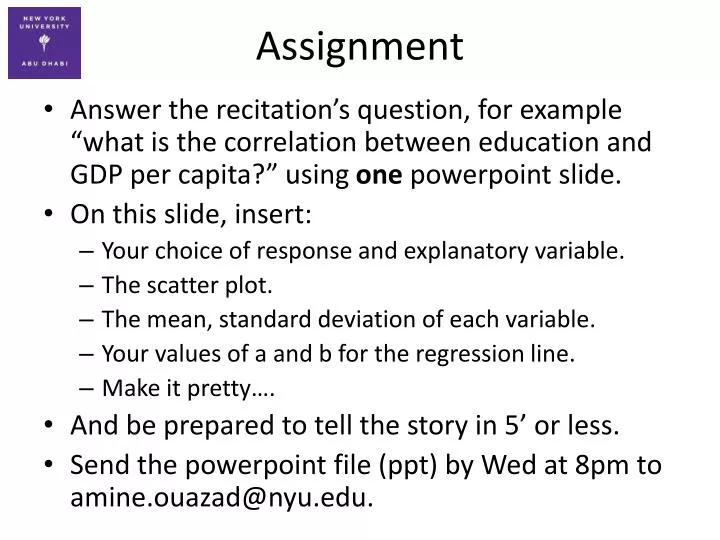
Assignment • Answer the recitation’s question, for example “what is the correlation between education and GDP per capita?” using one powerpoint slide. • On this slide, insert: • Your choice of response and explanatory variable. • The scatter plot. • The mean, standard deviation of each variable. • Your values of a and b for the regression line. • Make it pretty…. • And be prepared to tell the story in 5’ or less. • Send the powerpoint file (ppt) by Wed at 8pm to amine.ouazad@nyu.edu.
Useful stata commands • use filename.dta, clear • To open a Stata file that you downloaded on the recitation website. • describe • To list the variables of the data set that you opened using use. • codebook • To check whether variables are nominal, ordinal (categorical), or discrete or continuous (quantitative). • scatter y x • To obtain the scatter plot. You can then copy and paste in powerpoint. • regress y x • To obtain the values of a and b of the regression line. • summarize y, detail • To obtain the mean, median, and percentiles of the distribution of y. • summarize x, detail • Similarly for the distribution of x. • hist x • To do a histogram of x.