Download
1 / 1
10 likes | 223 Vues
Mokelumne River. Pardee & Camanche. Delta Outflow. Delta. Calaveras River. Shasta. Trinity. Whiskeytown. Trinity River. New Hogan. Clear Creek. Stanislaus River. San Joaquin River. San Luis. Oroville (SWP). Feather River. New Melones. Sacramento River. Dam Power Plant River

E N D
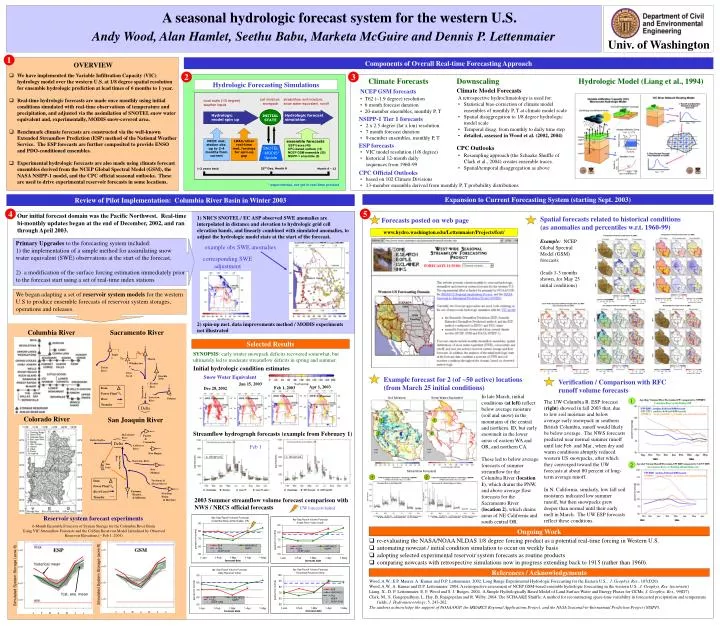
Mokelumne River Pardee & Camanche Delta Outflow Delta Calaveras River Shasta Trinity Whiskeytown Trinity River New Hogan Clear Creek Stanislaus River San Joaquin River San Luis Oroville (SWP) Feather River New Melones Sacramento River Dam Power Plant River Transfer Dam Power Plant River/Canal Transfer Tuolumne & Merced Rivers American River Folsom Eastman, Hensley, & Millerton Delta New Don Pedro & McClure Soil Moisture Snow Water Equivalent 1 1 Feb 1 2 2 observed observed Feb 1, 2003 Apr 1, 2003 Dec 28, 2002 Streamflow Forecasts 1 2 UW forecasts halted max historical mean Simulated System Storage (acre-ft) Simulated System Storage (acre-ft) fcst. ens. mean min A seasonal hydrologic forecast system for the western U.S. Andy Wood, Alan Hamlet, Seethu Babu, Marketa McGuire and Dennis P. Lettenmaier Univ. of Washington 1 Components of Overall Real-time Forecasting Approach OVERVIEW • We have implemented the Variable Infiltration Capacity (VIC) hydrology model over the western U.S. at 1/8 degree spatial resolution for ensemble hydrologic prediction at lead times of 6 months to 1 year. • Real-time hydrologic forecasts are made once monthly using initial conditions simulated with real-time observations of temperature and precipitation, and adjusted via the assimilation of SNOTEL snow water equivalent and, experimentally, MODIS snow-covered area. • Benchmark climate forecasts are constructed via the well-known Extended Streamflow Prediction (ESP) method of the National Weather Service. The ESP forecasts are further composited to provide ENSO and PDO-conditioned ensembles. • Experimental hydrologic forecasts are also made using climate forecast ensembles derived from the NCEP Global Spectral Model (GSM), the NASA NSIPP-1 model, and the CPC official seasonal outlooks. These are used to drive experimental reservoir forecasts in some locations. 2 3 Climate Forecasts Downscaling Hydrologic Model (Liang et al., 1994) Hydrologic Forecasting Simulations NCEP GSM forecasts Climate Model Forecasts • A retrospective hydroclimatology is used for: • Statistical bias-correction of climate model ensembles of monthly P, T at climate model scale • Spatial disaggregation to 1/8 degree hydrologic model scale • Temporal disag. from monthly to daily time step • detailed, assessed in Wood et al. (2002, 2004) • T62 (~1.9 degree) resolution • 6 month forecast duration • 20-member ensembles, monthly P, T NSIPP-1 Tier 1 forecasts • 2 x 2.5 degree (lat x lon) resolution • 7 month forecast duration • 9-member ensembles, monthly P, T ESP forecasts CPC Outlooks • VIC model resolution (1/8 degree) • historical 12-month daily sequences from 1960-99 • Resampling approach (the Schaake Shuffle of Clark et al., 2004) creates ensemble traces. • Spatial/temporal disaggregation as above CPC Official Outlooks • based on 102 Climate Divisions • 13-member ensemble derived from monthly P, T probability distributions Review of Pilot Implementation: Columbia River Basin in Winter 2003 Expansion to Current Forecasting System (starting Sept. 2003) 4 5 Our initial forecast domain was the Pacific Northwest. Real-time bi-monthly updates began at the end of December, 2002, and ran through April 2003. • NRCS SNOTEL / EC ASP observed SWE anomalies are interpolated in distance and elevation to hydrologic grid cell elevation bands, and linearly combined with simulated anomalies, to adjust the hydrologic model state at the start of the forecast. • 2) spin-up met. data improvements method / MODIS experiments not illustrated Spatial forecasts related to historical conditions (as anomalies and percentiles w.r.t. 1960-99) Forecasts posted on web page www.hydro.washington.edu/Lettenmaier/Projects/fcst/ Example: NCEP Global Spectral Model (GSM) forecasts (leads 1-3 months shown, for May 25 initial conditions) Primary Upgrades to the forecasting system included: 1) the implementation of a simple method for assimilating snow water equivalent (SWE) observations at the start of the forecast, 2) a modification of the surface forcing estimation immediately prior to the forecast start using a set of real-time index stations We began adapting a set of reservoir system models for the western U.S to produce ensemble forecasts of reservoir system storages, operations and releases. example obs SWE anomalies corresponding SWE adjustment Columbia River Sacramento River Selected Results SYNOPSIS: early winter snowpack deficits recovered somewhat, but ultimately led to moderate streamflow deficits in spring and summer. Initial hydrologic condition estimates Snow Water Equivalent Example forecast for 2 (of ~50 active) locations (from March 25 initial conditions) Verification / Comparison with RFC runoff volume forecasts Jan 15, 2003 In late March, initial conditions (at left) reflect below average moisture (soil and snow) in the mountains of the central and northern. ID, but early snowmelt in the lower areas of eastern WA and OR, and northern CA. These led to below average forecasts of summer streamflow for the Columbia River (location 1), which drains the PNW, and above average flow forecasts for the Sacramento River (location 2), which drains areas of NE California and south central OR. The UW Columbia R. ESP forecast (right) showed in fall 2003 that, due to low soil moisture and below average early snowpack in southern British Columbia, runoff would likely be below average. The NWS forecasts predicted near normal summer runoff until late Feb. and Mar., when dry and warm conditions abruptly reduced western US snowpacks, after which they converged toward the UW forecasts at about 80 percent of long-term average runoff. In N. California, similarly, low fall soil moistures indicated low summer runoff, but then snowpacks grew deeper than normal until their early melt in March. The UW ESP forecasts reflect these conditions. 1 Colorado River San Joaquin River Streamflow hydrograph forecasts (example from February 1) 2 2003 Summer streamflow volume forecast comparison with NWS / NRCS official forecasts Reservoir system forecast experiments 6-Month Ensemble Forecasts of System Storage for the Columbia River Basin Using VIC Streamflow Forecasts and the ColSim Reservoir Model Initialized by Observed Reservoir Elevations (~ Feb 1, 2001) Ongoing Work • re-evaluating the NASA/NOAA NLDAS 1/8 degree forcing product as a potential real-time forcing in Western U.S. • automating nowcast / initial condition simulation to occur on weekly basis • adopting selected experimental reservoir system forecasts as routine products • comparing nowcasts with retrospective simulations now in progress extending back to 1915 (rather than 1960). References / Acknowledgements Wood, A.W., E.P. Maurer, A. Kumar and D.P. Lettenmaier, 2002. Long Range Experimental Hydrologic Forecasting for the Eastern U.S., J. Geophys. Res., 107(D20). Wood, A.W., A. Kumar and D.P. Lettenmaier, 2004, A retrospective assessment of NCEP GSM-based ensemble hydrologic forecasting in the western U.S., J. Geophys. Res. (in review) Liang, X., D. P. Lettenmaier, E. F. Wood and S. J. Burges, 2004. A Simple Hydrologically Based Model of Land Surface Water and Energy Fluxes for GCMs, J. Geophys. Res., 99(D7). Clark, M., S. Gangopadhyay, L. Hay, B. Rajagopalan and R. Wilby, 2004. The SCHAAKE Shuffle: A method for reconstructing space-time variability in forecasted precipitation and temperature fields, J. Hydrometeorology, 5, 243-262. The authors acknowledge the support of NOAA/OGP, the IRI/ARCS Regional Applications Project, and the NASA Seasonal-to-Interannual Prediction Project (NSIPP).