Download
1 / 1
10 likes | 147 Vues
Figure S3. ATG. 100 bp Liem-176 Y486 Neg. C. 3’. 5’. 800. First primer set. A. VSG Fwd 1 5’TGGCGCTTGCAGCGCTGTGGC VSG Rv 1 5’TGCAGCTAGCATGGCGGCCAC. 600. 400. 100 bp Liem-176 Y486 Neg. C. Second primer set. B. VSG Fwd 2

E N D
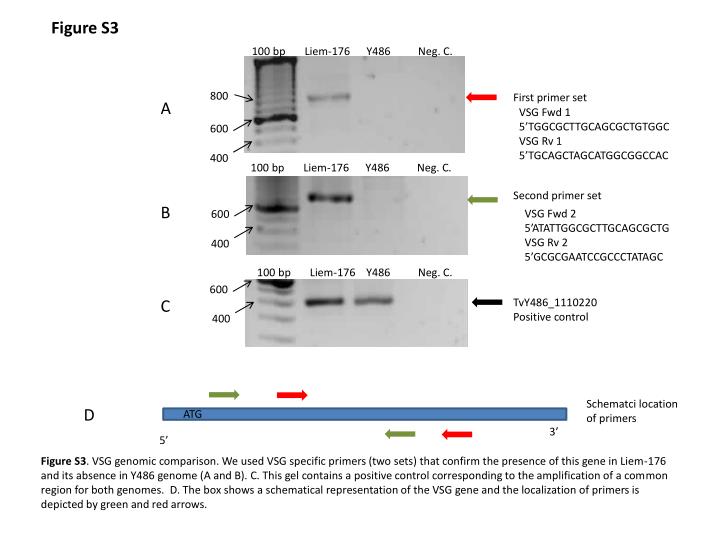
Figure S3 ATG 100 bp Liem-176 Y486 Neg. C. 3’ 5’ 800 First primer set A VSG Fwd 1 5’TGGCGCTTGCAGCGCTGTGGC VSG Rv 1 5’TGCAGCTAGCATGGCGGCCAC 600 400 100 bp Liem-176 Y486 Neg. C. Second primer set B VSG Fwd 2 5’ATATTGGCGCTTGCAGCGCTG VSG Rv 2 5’GCGCGAATCCGCCCTATAGC 600 400 100 bp Liem-176 Y486 Neg. C. 600 C TvY486_1110220 Positive control 400 Schematci location of primers D Figure S3. VSG genomic comparison. We used VSG specific primers (two sets) that confirm the presence of this gene in Liem-176 and its absence in Y486 genome (A and B). C. This gel contains a positive control corresponding to the amplification of a common region for both genomes. D. The box shows a schematical representation of the VSG gene and the localization of primers is depicted by green and red arrows.