Download
1 / 3
30 likes | 186 Vues
Schéma. Suivi long terme. Screening. Traitement actif et suivi jusqu’à progression. Bras A Rd continu. Bras C MPT. Bras B Rd18. MEL + PRED + THAL 12 cycles (72 sem.) Melphalan 0,25 mg/kg J1-4/42 Prednisone 2 mg/kg J1-4/42 Thalidomide 200 mg J1-4/42.

E N D
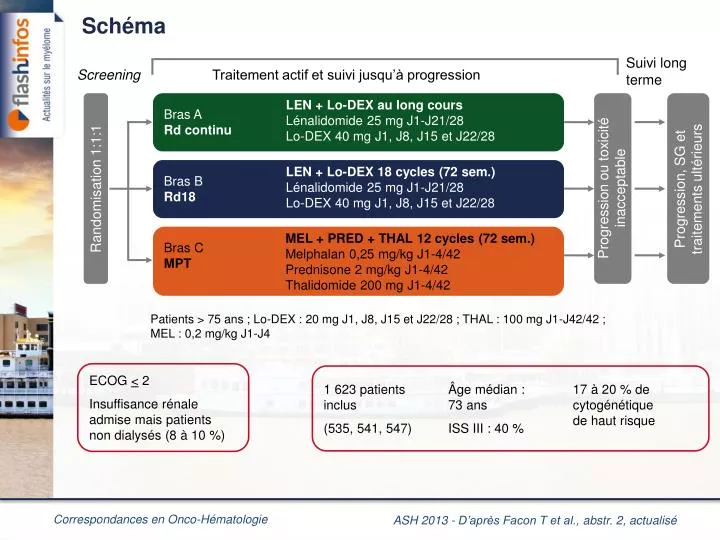
Schéma Suivi long terme Screening Traitement actif et suivi jusqu’à progression Bras A Rd continu Bras C MPT Bras B Rd18 MEL + PRED + THAL 12 cycles (72 sem.) Melphalan 0,25 mg/kg J1-4/42 Prednisone 2 mg/kg J1-4/42 Thalidomide 200 mg J1-4/42 LEN + Lo-DEX 18 cycles (72 sem.) Lénalidomide 25 mg J1-J21/28 Lo-DEX 40 mg J1, J8, J15 et J22/28 LEN + Lo-DEX au long cours Lénalidomide 25 mg J1-J21/28 Lo-DEX 40 mg J1, J8, J15 et J22/28 ASH 2013 - D’après Facon T et al., abstr. 2, actualisé Randomisation 1:1:1 Progression ou toxicité inacceptable Progression, SG et traitements ultérieurs Patients > 75 ans ; Lo-DEX : 20 mg J1, J8, J15 et J22/28 ; THAL : 100 mg J1-J42/42 ; MEL : 0,2 mg/kg J1-J4 ECOG < 2 Insuffisance rénale admise mais patients non dialysés (8 à 10 %) 1 623 patients inclus (535, 541, 547) Âge médian : 73 ans ISS III : 40 % 17 à 20 % de cytogénétique de haut risque
Survie sans progression ASH 2013 - D’après Facon T et al., abstr. 2, actualisé Hazard ratio Rd versus MPT : 0,72 p = 0,00006 Rd versus Rd18 : 0,70 p = 0,00001 Rd18 versus MPT : 1,03 p = 0,70349 S72 Rd Rd18 MPT 535 541 547 400 391 380 319 319 304 265 265 244 218 167 170 168 108 116 105 56 58 55 30 28 19 7 6 2 2 1 0 0 0
Survie globale (analyse intermédiaire)574 décès (35 % en ITT) ASH 2013 - D’après Facon T et al., abstr. 2, actualisé Hazard ratio Rd versus MPT : 0,78 ; p = 0,0168 Rd versus Rd18 : 0,90 ; p = 0,307 Rd18 versus MPT : 0,88 ; p = 0,184 Rd Rd18 MPT 535 541 547 488 505 484 457 465 448 433 425 418 403 393 375 338 324 312 224 209 205 121 124 106 43 44 30 5 6 3 0 0 0