Download
1 / 38
380 likes | 506 Vues
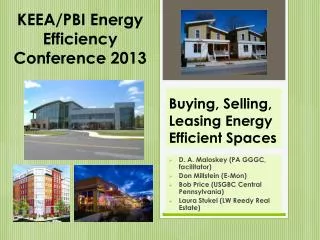
KEEA/PBI Energy Efficiency Conference 2013. Buying, Selling, Leasing Efficient Spaces. Metering Dashboards Don Millstein E-Mon. President – E-Mon Primary responsibilities include: E-Mon Electrical Submeters Honeywell Electrical Products Honeywell Lighting Controls

E N D
KEEA/PBI Energy Efficiency Conference 2013 Buying, Selling, Leasing Efficient Spaces Metering Dashboards Don Millstein E-Mon
President – E-Mon Primary responsibilities include: E-Mon Electrical Submeters Honeywell Electrical Products Honeywell Lighting Controls 20+ years in the Electrical Meter Industry Don Millstein 2
Agenda • Energy Dashboards • Metering & Submetering Overview • Top Verticals – Market Drivers & Applications
What Do Customers Want Graph Bill Energy Management, Benchmarking, Dashboards, Anomalies Tenant Billing, Cost Allocation, Measurement & Verification, LEED
Give the Customer Visualization Options • Sneaker Reads • Local Dashboard Displays • PC Based Energy Software • Meter Reading Service • Cloud-based Dashboard Service • Dashboard and Energy Analytics • Turn-key Solutions – Dashboard, Analytics and Rolling Trucks
Dashboard Types – Energy Load • kW Demand • kWh Consumption • Load profile • Current • Last X days/ weeks/ months • Baseline • Average comparison
Dashboard Types – Carbon Footprint • Absorbing • # Trees/ year • Forest area • Emission • Gallons of gas • Miles of driving • More info: • Several web resources… http://www.epa.gov/cleanenergy/energy-resources/calculator.html
Submeter Integration Visualization of Granular Energy Data
Metering vs. Submetering • What is submetering? • Defined as a metering device installed after the main utility meter • Used for capturing facility energy data at a specific location, panel, circuit or user. • Delivers granularity of facility energy performance data Submeters –The critical component for accessing facility energy related data
Submetering Applications • Historical Applications • Tenant billing • Cost allocation • Energy management • Growth Applications • Measurement & Verification • Green buildings • Building automation • Carbon footprint analysis • Renewable energy • Power Quality Analysis • Predictive Maintenance
Overview: Electro-Mechanical Meter • The Electro-Mechanical Meters • Typical Utility type Meter • Available in various amperages • Power passes through meter, then to distribution panel • Requires substantial physical space for installation • One meter per building • Restricted ability to sell multiple meters per customer site
Overview: Sensor-based Submeters • Non-Socket, Current Sensor Based Technology • Limited or no Power interruption • Lower installed cost • No CT Cabinets • No Meter Socket • Reduced cabling and conduit • 1/10 the time to install • Space saving and flexibility in location • Multiple submeters per locations increases revenue stream
Value Proposition - Landlords • Equitable tenant billing, recover common area energy cost, encourage energy conservation • Lower overall operating expenses of facility • Optimize integration with building automation system • Reduce risk related to fluctuation in utility rates • Potential to lower base rent and be more competitive in the market
Value Proposition - Landlords • Mitigate tenant complaints, they control their utility expense • Aggregate portfolio energy cost to negotiate with utility providers • Increase tenant retention & lower vacancy rate • Market property as a green building • Increase value of property based on operating profit, improved rent roll and green attributes
Value to the Customer • Submetering provides: • Granular and in-depth review of the customers facility energy data • Analysis of the facilities energy performance at the granular level • Ability to immediately isolate energy anomalies • A tool to make better informed decisions that help optimize energy performance • Allocation of energy costs – tenant, department or process • Integration into BAS systems • Capability to monitor and identify “high use” pieces of equipment for load shedding • Early access to maintenance issues for repair before critical equipment fails • Better management of Green Initiatives Can your customer benefit from an Energy Metering Solution?
Top Industries For Submetering • Building Automation • Federal Government • College & Universities • Owner Occupied / Commercial Facilities • Health Care Facilities • Data Centers • Property Management / Multi-Tenant Facilities • Multi-Family / Apartments • Hotels, Airports & Stadiums • K-12 Schools • Green Buildings
Top Industries and Applications Submeter market drivers
Building Automation • Applications • Metering is low-cost first in point for BMS • Interoperability of protocols • Modbus, BACnet, Lonworks • Peak demand thresholds trigger load management controls • Identify areas of waste • Optimize installation of energy conservation products • Market Drivers • Need for more granular energy info • System Integrators seeing metering on jobs • Growing importance of Measurement & Verification • M&V for HVAC and Lighting
Federal Government • Market Drivers • EPACT 2005 requires all 500,000 federal buildings be metered by 2012 • EISA 2007 requires Federal energy reduction of 30% • Military has Money • Energy independence & security • Growing concern over Carbon Footprint • Applications • Energy Management • Measurement & Verification • Validate ESCO contracts • Multi-tenant facilities • Carbon footprint analysis
College & Universities / K-12 Schools • Application • LEED Points – EA Credits • Optimize Energy Performance • Enhanced Commissioning • Measurement & Verification • Integration to BMS/EMS • Detailed energy accountability • Load shedding • Energy Conservation • Benchmarking & Energy Analysis • Education • College students want visibility to their impact on the planet • Tenant Billing / Cost Allocation • Market Drivers • USGBC LEED Certification • K-12 – 1,705 reg. 255 certified • Higher Ed – 3,050 reg. 531 certified • Must be GREEN to get $ GREEN $ • Integration to BAS / EMS • Energy Conservation • Energy Education • Educate them young • Higher Ed – students demand visibility • Tenant Billing / Cost Allocation • College & Universities have dedicated financial allowances
Owner Occupied Commercial Facilities • Applications • LEED Points – EA Credits • Optimize Energy Performance • Enhanced Commissioning • Measurement & Verification • Integration to BMS/EMS • Detailed energy accountability • Load shedding • Energy Conservation • Benchmarking • Identify energy conservation opportunities • Analysis of energy initiatives • Environmental Impact • Carbon footprint • Good corporate citizen • Cost Allocation • Market Drivers • USGBC LEED Certification • Public pressure to be a good corporate citizen • Green Building Policies • State and local governments implementing green building policies • Budget Constraints • Economy straining the bottom line • Owners no longer view electric bill as necessary evil • Energy Conservation • Buildings consumer 72% of the nation’s electricity and 38% of all CO2 • Cost Allocation • Allocate energy usage and cost by department, process or production line
Health Care Facilities • Applications • Tenant Billing • Doctors offices • X-ray & MRI labs • Emergency rooms • Various clinics • Blood labs • Outsourced food services • Outsourced laundry • Energy Management • Peak Avoidance – MRI • Lighting upgrades • Behavioral Change • VFDs • HVAC/Cooling tower analysis • Market Drivers • $6.5 Billion in energy • 2.5 x avg. building use • 2nd most intensive behind food • 24/7 Operation • Energy intensive equipment • Tight budgets • $1 saving is $20 in hospital revenue • $1 savings is $10 in medical office revenue
Data Centers • Application • Power quality analysis to maintain “Up-time” • Multi-tenant server farms, tenant billing • PUE calculations • Breakout HVAC, lighting, plug, racks • Branch circuit monitoring • Determine facility Carbon Footprint • Assist in calculating size of HVAC and rack power • Market Drivers • 3% of USA electrical consumption • 24/7 facilities – corporate owned and tenant server farms • Power quality analysis to limit downtime • LEED and DOE driving standards in Data Centers • PUE Standard (Power Usage Effectiveness) • Efficiency of energy usage from CPU, cooling, etc. • Sizing of HVAC equipment • Greenhouse gas reporting • Branch circuit monitoring
Property Management / Multi-Tenant Facilities • Applications • Recovery of tenant energy cost, encourage energy conservation • Reduce risk related to fluctuation in utility rates • Potential to lower base rent • Mitigate tenant complaints, they control their utility expense • Aggregate portfolio energy cost to negotiate with utility providers • Increase value of property based on green attributes • Market Drivers • Equitable tenant billing • Lower overall operating expenses • Optimize integration with building automation system • Market competitiveness • Utility price optimization • Tenant retention • Green
Hotels, Airports & Stadiums • Mixed-Use Hotels & Condo • Retail first floor, Hotel next 10 floors, Condos at top • Airports • All under construction and expansion • Multi-tenant and energy conservation • ARRA funding • Stadiums • Many new construction projects • Growing importance of Value Engineering • Most metering goes in as retro-fit
Comcast Center - Philadelphia Tallest LEED Building in the US – 975 ft 1.25 Million Sq. Ft. 3,000 occupants LEED-CS Gold Rating Over 400 Meters Electric, Gas, Water BTU, Steam, Airflow Meters feed data into two systems E-Mon Energy Software Trane Building Automation System
Bethke Elementary School, CO • Challenge • 63,000 sq ft facility • Gain understanding of energy cost throughout the facility • Identify low-cost opportunity for LEED points • Solution • E-Mon meters monitor lighting, mechanical rooms and kitchen electric panels • Meters feed data into BAS system • Result • First LEED Gold Certified School in the US • Meter data supported 50% energy savings from the following actions • Indirect evaporative cooling • high-efficiency boilers • Operable windows • 90% day lighting strategies • Renewable energy • Behavioral change
LA Airforce Base • Identify energy saving opportunities • Verification of Savings • Energy Budgeting • Comply with energy reduction mandates
LA Airforce Base Hardware • Over 50 E-Mon D-Mon submeters • 21 IDR data accumulators • E-Mon Energy software • Est. Cost $50k • Used to verify over $1 million in savings
26 Buildings throughout Detroit Meter each building to verify energy savings for lighting retro-fit 3rd-party meter reading Computerized system
BILL GATES HOUSE • 7 YEARS TO BUILD • 45,000 SQUARE FT. • EST. $53 MILLION • HOME THEATRE • 18 HOLE PUTTING GREEN • 100 PERSON HALL • BADGE SYSTEM
BILL’S $30,000 PER MONTH ELECTRIC BILL • THREE 800 AMP PANELS • ELECTRIC ENGINEER OFFICE • INSTALLED MMU-12 • SOFTWARE ON WIN95 • $30,000 PER MONTH • SWITCH FROM RESIDENTIAL TO COMMERCIAL RATE
Thank you for your time Don Millstein President – E-Mon dmillstein@emon.com