Download
1 / 18
190 likes | 561 Vues
4-4 Graphing Sine and Cosine. Chapter 4 Graphs of Trigonometric Functions. Warm-up. Find the exact value of each expression. sin 315 ° cot 510 °. 6-3 Objective: Use the graphs of sine and cosine (sinusoidal) functions 6-4 Objectives:

E N D
4-4 Graphing Sine and Cosine Chapter 4 Graphs of Trigonometric Functions
Warm-up Find the exact value of each expression. • sin 315° • cot 510°
6-3 Objective: Use the graphs of sine and cosine (sinusoidal) functions • 6-4 Objectives: • Find amplitude and period for sine and cosine functions, and • Write equations of sine and cosine functions given the amplitude and period. • Graph transformations of the sine and cosine functions
http://www.univie.ac.at/future.media/moe/galerie/fun2/fun2.htmlhttp://www.univie.ac.at/future.media/moe/galerie/fun2/fun2.html
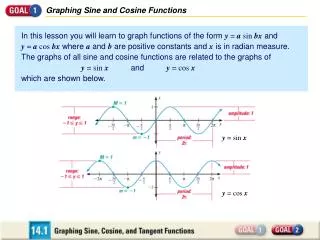
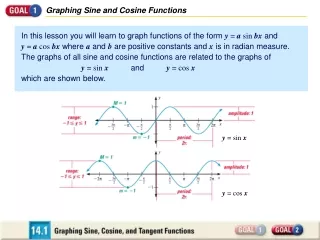
Recreate the sine graph. • Domain and Range • x- and y-intercepts • symmetry
Recreate the cosine graph. • Domain and Range • x- and y-intercepts • symmetry
KeyConcepts: Transformations of Sine and Cosine Functions For y = a sin (bx + c) + d and y = a cos (bx + c) + d, Amplitude (half the distance between the maximum and the minimum values of the function or half the height of the wave) = |a|
Example 1 • Describe how the graphs of f(x) = sin x and g(x) = 2.5 sin x are related. Then find the amplitude of g(x). Sketch two periods of both functions.
Example 2 Reflections • Describe how f(x) = cos x and g(x) = -2cos x are related. Then find the amplitude of g(x). Sketch two periods of both functions.
KeyConcepts: Transformations of Sine and Cosine Functions For y = a sin (bx + c) + d and y = a cos (bx + c) + d, Period (distance between any two sets of repeating points on the graph) =
Example 3 • Describe how the graphs of f(x) = cos x and g(x) = cos are related. Then find the period of g(x). Sketch at least one period of both functions.
KeyConcepts: Transformations of Sine and Cosine Functions For y = a sin (bx + c) + d and y = a cos (bx + c) + d, Frequency (the number of cycles the function completes in a one unit interval) = (note that it is the reciprocal of the period or )
Example 4 A bass tuba can hit a note with a frequency of 50 cycles per second (50 hertz) and an amplitude of 0.75. Write an equation for a cosine function that can be used to model the initial behavior of the sound wave associated with the note.
KeyConcepts: Transformations of Sine and Cosine Functions For y = a sin (bx + c) + d and y = a cos (bx + c) + d, Phase shift (the difference between the horizontal position of the function and that of an otherwise similar function) =
Example 5 • State the amplitude, period, frequency, and phase shift of . Then graph two periods of the function.
KeyConcepts: Transformations of Sine and Cosine Functions For y = a sin (bx + c) + d and y = a cos (bx + c) + d, Vertical shift (the average of the maximum and minimum of the function) = d (Note the horizontal axis—the midline–is y = d)
Example 6 • State the amplitude, period, frequency, phase shift, and vertical shift of y = sin (x + π) + 1. Then graph two periods of the function.
Assignment P. 264, 1, 3, 9, 15, 17, 19.