Download
1 / 45
460 likes | 676 Vues
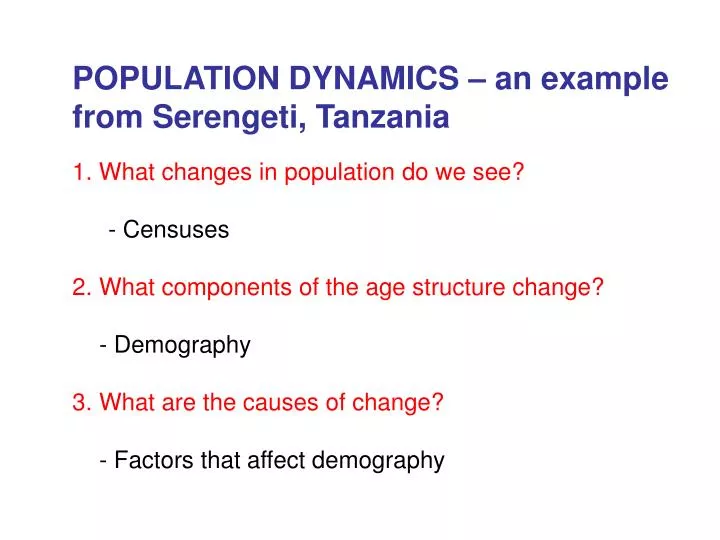
POPULATION DYNAMICS – an example from Serengeti, Tanzania 1. What changes in population do we see? - Censuses 2. What components of the age structure change? - Demography 3. What are the causes of change? - Factors that affect demography. CENSUSES. Changes over time

E N D
POPULATION DYNAMICS – an example • from Serengeti, Tanzania • 1. What changes in population do we see? • - Censuses • 2. What components of the age structure change? • - Demography • 3. What are the causes of change? • - Factors that affect demography
CENSUSES • Changes over time 2. Rates of increase
The Serengeti Ecosystem Isuria Scarp Loitaplains KENYA Rift valley Gelai2962 Salai plains TANZANIA Ol DoinyoLengai Serengetiplains Ketumbaine2942 Olduvaigorge Meru4565 Rift valley From Grant Hopcraft
Serengeti Wildebeest Population 1800 1500 1200 Population Size (x 1000) 900 600 300 0 1950 1960 1970 1980 1990 2000
DEMOGRAPHY 1. Inputs: conceptions births 2. Outputs: mortality 3. Lifetable: age distributions
Decline following Drought in 1993
Impala recruits 6 months 1 year
Serengeti Warthog Recruitment 2.5 2.0 1.5 Juveniles / Female 1.0 0.5 0.0 1980 1985 1990 1995 2000 2005
WILDEBEEST ADULT MORTALITY Density dependent Inverse density dependent Data from Mduma, Sinclair et al 1999
BUFFALO MORTALITY Density dependent
AFRICAN BUFFALO LIFETABLE Age-specific survivorship Age-specific mortality Survivorship
CAUSES OF CHANGE 1. Food 2. Intraspecific competition 3. Interspecific competition • Disease 5. Predation – will deal in later lectures 6. Human hunting
Serengeti Grass Growth - Dry season woodlands 9000 6000 Biomass (kg/ha) 3000 0 0 300 600 900 1200 Cumulated Rain (mm)
INTRASPECIFIC COMPETITION Intraspecific competition occurs when there are insufficient resources (e.g. food, space) for all individuals in the population for a part of the year e.g. wildebeest and buffalo in Serengeti dry season
Serengeti Wildebeest per capita Dry Season Food 350 300 250 200 150 100 50 0 1960 1970 1980 1990 2000
Wildebeest adult mortality due to lack of food is density dependent
WILDEBEEST Food protein and bone marrow
INTERSPECIFIC COMPETITION • Between migrating grazers • - with gazelle • - not with zebra • 2. Between migrant and resident grazers • - wildebeest and buffalo
WILDEBEEST, ZEBRA, THOMSON’S GAZELLE Wildebeest Gazelle Zebra
DISEASE • Many diseases appear when animals • have insufficient food and so their • immune systems are impaired. These operate • together with food to cause mortality • 2. Other diseases are Epidemic exotics – • rinderpest virus • 3. Enzootic – distemper from domestic dogs, • rabies. These act more like predators • and will be dealt with later
Serengeti Wildebeest Population Rinderpest removed Data from Mduma & Sinclair
Serengeti Wild Dogs suffered decadal outbreaks of distemper since the 1960s
Conclusions on regulation • Large ungulate species food regulated through • Intraspecific competition • Migrant species food regulated • Small resident ungulate species predator regulated • (see later lecture) • Top predators are food regulated • (Smaller predators are limited by top predators) • Disease works with food under natural conditions • Interspecific competition occurs between the grazers