Download
1 / 28
280 likes | 442 Vues
Longevity 5 Conference | September 25, 2009. Pensioner Longevity Data Analysis and Applications. US Mortality Data and Analysis. About Hewitt Associates. Our Business For almost 70 years, providing best-in-class HR Consulting and Outsourcing $3.2 billion in net revenue for fiscal 2008

E N D
Longevity 5 Conference | September 25, 2009 Pensioner Longevity Data Analysis and Applications
About Hewitt Associates • Our Business • For almost 70 years, providing best-in-class HR Consulting and Outsourcing • $3.2 billion in net revenue for fiscal 2008 • Located in 33 countries with approximately 23,000 associates • Consulting – Global • More than 3,000 large and mid-size companies around the world (34% revenue) • Benefits Outsourcing – US-centric • Defined Benefit • Defined Contribution • Health & Welfare • More than 300 organizations worldwide (49% revenue) • Multi-Process Human Resource Outsourcing – US-centric • More than 30 organizations (17% revenue)
The Implication • Focus on Data Available in US Defined Benefit Outsourcing Business • Hewitt administers pension benefits for over 100 clients • Generally large global organizations • Large over 20,000 employees • Hewitt administers retirement benefits for about 15 million participants • Roughly breaks down as follows: • 45% active employees, 40% retirees, 15% deferred vested • We are sitting on a uniquely large employee benefits database with information • Particular interest for longevity data because participants must be tracked ongoing • Detailed demographic data (economic status: pay; geographic status: address) • Information augmented by Social Security Death Index can create all data needed • Remainder of the discussion of our analysis will focus solely on US data
What We Have… • Clean Data on Most of the Lives in our Databases • Between 75-100 million life-years during 2000’s • Only 26 million life-years used in today’s analysis • Compare to previous US pensioner mortality studies • RP-2000: 11 million life-years • Today’s data from 31 Hewitt clients with a fairly broad industry mix • For all employees who have worked for employers while contracted with Hewitt • Indicative data: SSN, DOB, DOH, Status (active, disabled, terminated, retired) • Benefits data: pay, benefit level, total service, annuity option, etc. • Other data: city, state, ZIP, marital status, etc.
What We Have…(cont’d) • Clean Data on Most of the Lives in our Databases • Analysis today based on a subset looking at 4.9 million lives (subset of Hewitt data) • SSN, DOB, DOH, last-known ZIP (mailing checked to pensioners when they died) • Allocating all life-years for each person based on last-known • Results are preliminary – may contain some noise from cashed-out or terminated non-vested • Venturing into “uncharted territory” in comparative analysis • Most comparative longevity analyses have focused on Actual vs. Expected • Ours is focused on a concurrent experience among separate subsets of data
Today’s Hypothesis • Consistent with past analyses of CDC and Census Bureau: Geography matters • Not only does geography matter, but that it matters down to ZIP code • Implicit that socio-economic status will provide high-correlation • More robust view of geographic dispersion than past analyses by state and metro-region • Looking at some of our outstanding issues: they don’t matter much • The primary problem is the accuracy of tracking participants that “leave” • We would expect any issues like this to persist consistently across ZIP • In the interest of credibility we focus on ZIP-3 • A few words about the US postal system…
The US population distribution • Map of ZIP-3s across the US by total population
Where Our Data is Most Robust • Map of ZIP-3s across the US by total exposures (life-years)
How This Compares to the Actual US Population • ZIP-3 relative Hewitt exposures vs US Pop Distribution
What Our Data Had to Say • Map of Relative Longevity in ZIP-3s across the US – white represents no deaths
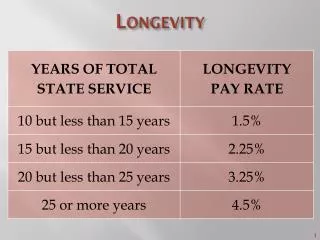
Top 10 ZIP-3’s (Greatest Longevity) 508 – Creston, Iowa 828 – Sheridan, Wyoming 820 – Cheyenne, Wyoming 692 – Valentine, Nebraska 855 – Globe, Arizona 595 – Havre, Montana 999 – Ketchikan, Alaska 514 – Carroll, Iowa 573 – Central South Dakota 328 – Orlando, Florida Bottom 10 ZIP-3’s (Worst Longevity) 481-482 – Detroit, Michigan 636 – Cape Girardeau, Missouri 469 – Kokomo, Indiana 434-436 – Toledo, Ohio 473 – Muncie, Indiana 219 – Baltimore, Maryland 630-631 – St. Louis, Missouri 549 – Oshkosh, Wisconsin 610-611 – Rockford, Illinois 453-455 – Dayton, Ohio What Our Data Had to Say (cont’d)
The “Red Belt” • Quite Obviously, there is a substantive region from Texas up to Great Lakes • Forms the collective of the Great Lakes Region, Texarkana, Deep South • Represents where there is generally lower average income according to US Census Bureau • Also, generally a low availability of services (healthcare, infrastructure, etc.) • Coasts and the Northern Plains provide meaningfully better longevity
A Brief Preview of Hewitt Data versus SOA RP-2000 • Ages 30 to 60 • More than 2.5 times the number of lives than RP-2000 • Less reliance on auto-maker data • Generally consistent longevity curve • Matches quite nicely, but begins to degrade towards age 60 Note: RP-2000 curve reflects smoothing techniques. None used on “Hewitt Q’s”.
A Brief Preview of Hewitt Data versus SOA RP-2000 • Ages 60 to 90 • Rates of death are 33% lower by early 70’s • RP-2000 indicates mortality levels nearly twice that of Hewitt data by mid-80’s Note: RP-2000 curve reflects smoothing techniques. None used on “Hewitt Q’s”.
Impact on the Aggregate S&P 500 Pension Costs • (in $billions) +30% +5% 72 2,276 2,167 55
Some Closing Thoughts • Seeking Input on Some of our Data Challenges • Looking for practitioners with experience in these large-scale mortality studies • Looking for practitioners with experience or interest in comparative longevity • Reactions to this data?
Longevity as worrying as equities? Longevity risk in a UK pension scheme context Source: Hewitt Global Risk Survey 2008 – UK Responses
Standard tables • No cohort analysis • Immature schemes + high net interest rates= defer thinking • Mortality improvements analysed by cohort • Fading mortality improvements still the norm • Mortality treated as base + improvement • Continued future mortality improvement taken seriously • Mortality rating by address (initially only bulk annuities, now individuals) • Per person mortality rating is standard • Longevity risk understood, routinely priced, even traded ? Evolution of mortality modelling in the UK
The UK Hewitt Longevity Model • Socio-economic factors do not depend on scheme, so we can • pool data between many schemes • develop a model based on the pooled data • The UK Hewitt Longevity Model is The use of • access to substantial pooled mortality data, plus • socio-economic information we infer from addresses to improve our estimate of individual longevity
The UK Hewitt Longevity Model • Member postcodes mapped to database supplied by Experian (provider of information and analytics) to estimate member's socio-economic type • A socio-economic type is a grouping of individuals having similar characteristics measured in terms of wealth and lifestyle, and therefore likely to share a similar future mortality experience • Further grouped these socio-economic types into clusters based on the combined mortality experience of Hewitt client pension schemes so that we can model them statistically • Map of UK illustrates how individuals with different postcodes are mapped to different mortality clusters • For each of the different socio-economic clusters, determined a mortality assumption based on the collected mortality experience of Hewitt clients • We augment the model using Government mortality statistics for regions of UK on a per member basis. • Some insurers now provide lower payments to pensioners in more affluent areas
Longevity risk components Systematic Risk Changes in general longevity for a big population (e.g. England and Wales, or insured lives, or SAPS) Basis Risk How your scheme differs from the big population, and the difficulty of measuring this and its implications. Idiosyncratic Risk Even if you knew the “correct” mortality rate, experience will differ, particularly in small schemes. “First person to live to 1,000 might be 60 already”
Market for longevity risk • Until recently • The main (the only?) way to reduce/remove longevity risk was via a bulk annuity type solution • Can modify future benefits but cant deal with past obligations • But Now • The Longevity swaps market exists • Missing piece of risk management jigsaw?
Scheme specific longevity swaps—a simple concept Monthly payment to scheme until pensioner dies PENSION SCHEME PROVIDER PENSIONER Floating Leg Fixed leg Monthly payment until pensioner dies Monthly pension payment to provider for fixed term
Structuring your Swap • Made to Measure or Off the Peg?
Sex Time since retirement Lifestyle Pension size Age Current health Year of birth Occupation Smoke Month of birth Country you live in Where you live Fitness How do the longevity providers price? • Pricing process (scheme-specific swaps): • Deduce best-estimate of mortality for the population • Using postcode rating factors & scheme experience • Add risk margins for the uncertainty, cost of capital and profit
Overview of the market to date • Market really took off in Summer 2008 • Providers put specialist teams in place to target UK pension scheme trustees • Babcock and RSA deals are first swaps written directly with a UK pension scheme • Large pipeline of transactions • Already seeing standardisation of product in the market • Have to ensure price comparisons between providers are “like-for-like” • Providers generally fall into two categories: • Investment banks • Distribution of risk to third parties • Insurers (incl. reinsurance) companies • Retain risk on balance sheet or reinsure