Download
1 / 1
20 likes | 173 Vues
Lower tropospheric COS as main source of stratospheric background aerosol, a CCM study Christoph Brühl (1), Holger Tost (2), Paul Crutzen (1), Jos Lelieveld (1), and Francois Benduhn (1) (1) Max-Planck-Institut für Chemie, Mainz, Germany, (2) Universität Mainz, Germany. Abstract:

E N D
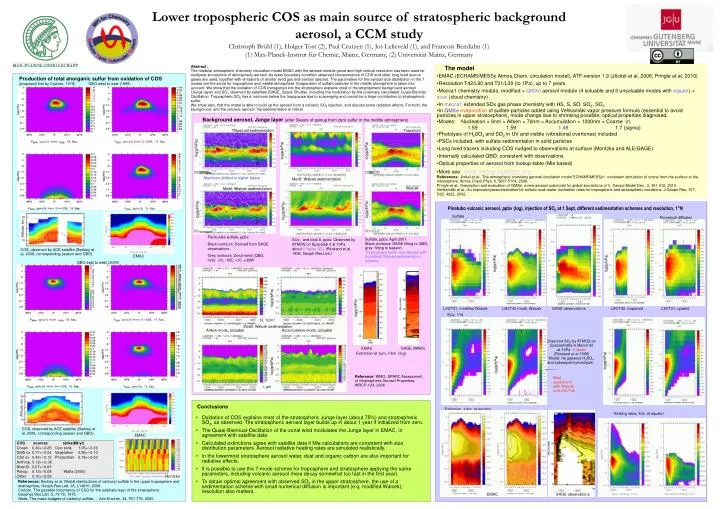
Lower tropospheric COS as main source of stratospheric backgroundaerosol, a CCM studyChristoph Brühl (1), Holger Tost (2), Paul Crutzen (1), Jos Lelieveld (1), and Francois Benduhn (1)(1) Max-Planck-Institut für Chemie, Mainz, Germany, (2) Universität Mainz, Germany Abstract: The modular atmospheric chemistry circulation model EMAC with the aerosol module gmxe and high vertical resolution has been used for multiyear simulations of atmospheric aerosol. As lower boundary condition observed concentrations of COS and other long lived source gases are used, together with emissions of shorter lived gas and aerosol species. The parameters for the aerosol size distribution in the 7 modes are the same for troposphere and middle atmosphere. Evaporation of sulfate particles in the middle atmosphere is taken into account. We show that the oxidation of COS transported into the stratosphere explains most of the stratospheric background aerosol (Junge layer) and SO2 observed by satellites (SAGE, Space Shuttle), including the modulation by the (internally calculated) Quasi-Biennial Oscillation. Tropospheric SO2 has a minimum below the tropopause due to scavenging and cannot be a large contribution to stratospheric sulfur. We show also, that the model is able to build up the aerosol from a volcanic SO2 injection, and discuss some radiation effects. For both, the background, and the volcanic aerosol, the sedimentation is critical. • The model • EMAC (ECHAM5/MESSy Atmos.Chem. circulation model), ATF-version 1.9 (Jöckel et al, 2006; Pringle et al, 2010) • Resolution T42/L90 and T31/L39 (to 1Pa), up to 7 years • Mecca1 chemistry module, modified + GMXe aerosol module (4 soluable and 3 unsoluable modes with eqsam) + scav (cloud chemistry) • In mecca1 extended SOx gas phase chemistry with HS, S, SO, SO2, SO3 • In GMXeevaporation of sulfate particles added using Vehkamäki vapor pressure formula (essential to avoid particles in upper stratosphere), mode change due to shrinking possible; optical properties diagnosed. • Modes: Nucleation < 6nm < Aitken < 70nm < Accumulation < 1000nm < Coarse (r) 1.59 1.59 1.49 1.7 (sigma) • Photolysis of H2SO4 and SO2 in UV and visible (vibrational overtones) included • PSCs included, with sulfate sedimentation in solid particles • Long lived tracers including COS nudged to observations at surface (Montzka and ALE/GAGE) • Internally calculated QBO, consistent with observations • Optical properties of aerosol from lookup-table (Mie based) • More seewww.messy-interface.org • References: Jöckel et al., The atmospheric chemistry general circulation model ECHAM5/MESSy1: consistent simulation of ozone from the surface to the mesosphere. Atmos.Chem.Phys. 6, 5067-5104, 2006. • Pringle et al., Description and evaluation of GMXe: a new aerosol submodel for global simulations (v1). Geosci.Model Dev.. 3, 391-412, 2010. • Vehkamäki et al., An improved parameterization for sulfuric acid–water nucleation rates for tropospheric and stratospheric conditions. J.Geoph.Res. 107, D22, 4622, 2002. Production of total anorganic sulfur from oxidation of COS (proposed first by Crutzen, 1976) QBO west to east (1999) Background aerosol, Junge layer (after 3years of spinup from zero sulfur in the middle atmosphere) Trapezoid sedimentation Trapezoid log(p/hPa) log(p/hPa) log(p/hPa) Maximum shifted to higher layers Modif. Walcek sedimentation Walcek Modif. Walcek sedimentation Observed SO2 by ATMOS on Spaceshuttle in March 92 at 1hPa 0.4ppbv (Rinsland et al 1995) Mostly via gaseous H2SO4 and subsequent photolysis log(p/hPa) log(p/hPa) Pinatubo volcanic aerosol, ppbv (log), injection of SO2 at 1 Sept, different sedimentation schemes and resolution, 1°N log(p/hPa) Sulfate 30 Numerical diffusion Altitude, km Particulate sulfate, ppbv. Black contours: Derived from SAGE observations Grey contours: Zonal wind (QBO, m/s): -30, -10E, +10, +30W SOx, and total S, ppbv. Observed by ATMOS on Spacelab 3 at 1hPa about 0.1ppbv SO2 (Rinsland et al, 1995, Geoph.Res.Lett.) Sulfate, ppbv, April 2001. Black contours: SAGE fitting to QBO, grey: fitting to season. Tropical pipe better reproduced with (modified) Walcek sedimentation scheme 10 COS, observed by ACE satellite (Barkley et al, 2008, corresponding season and QBO) EMAC log(p/hPa) log(p/hPa) QBO east to west (2000) log(p/hPa) log(p/hPa) L39/T31, modified Walcek L90/T42 modif. Walcek SAGE observations L90/T42, trapezoid L39/T31, upwind SOx, 1°N N, 1/cm³ Modif. Walcek sedimentation Aitken-mode, soluable Accumulation-mode, soluable EMAC SAGE (WMO) Extinction at 1µm, 1/km (log) log(p/hPa) log(p/hPa) log(p/hPa) Reference: WMO, SPARC Assessment of Stratospheric Aerosol Properties, WRCP-124, 2006 Best agreement with Walcek and L90/T42 r, µm 30 Conclusions Altitude, km Extinction, 1/km, at equator Heating rates, K/d, at equator • Oxidation of COS explains most of the stratospheric Junge layer (about 75%) and stratospheric SO2, as observed. The stratospheric aerosol layer builds up in about 1 year if initialized from zero. • The Quasi-Biennual-Oscillation of the zonal wind modulates the Junge layer in EMAC, in agreement with satellite data • Calculated extinctions agree with satellite data if Mie calculations are consistent with size distribution parameters. Aerosol radiative heating rates are simulated realistically. • In the lowermost stratosphere aerosol water, dust and organic carbon are also important for radiative effects. • It is possible to use the 7-mode scheme for troposphere and stratosphere applying the same parameters, including volcanic aerosol (here decay somewhat too fast in the first year). • To obtain optimal agreement with observed SO2 in the upper stratosphere, the use of a sedimentation scheme with small numerical diffusion is important (e.q. modified Walcek); resolution also matters. 10 COS, observed by ACE satellite (Barkley et al, 2008, corresponding season and QBO) EMAC COS sources sinks(Mt/yr) Ocean 0.30+/-0.25 Oxic soils 1.05+/-0.36 DMS ox 0.17+/-0.04 Vegetation 0.56+/-0.10 CS2 ox 0.42+/-0.12 Photochem 0.18+/-0.03 Anthrop. 0.12+/-0.06 Biom.B. 0.07+/-0.05 Precip. 0.13+/-0.08 Watts (2000) Other 0.10+/-0.08 Montzka References: Barkley et al, Global distributions of carbonyl sulfide in the upper troposphere and stratosphere, Geoph.Res.Lett. 35, L14810, 2008. Crutzen, The possible importance of CSO for the sulphate layer of the stratosphere. Geophys.Res.Lett. 3, 73-76, 1976. Watts, The mass budgets of carbonyl sulfide…, Atm.Environ. 34, 761-779, 2000. EMAC SAGE observations