Download
1 / 5
70 likes | 274 Vues
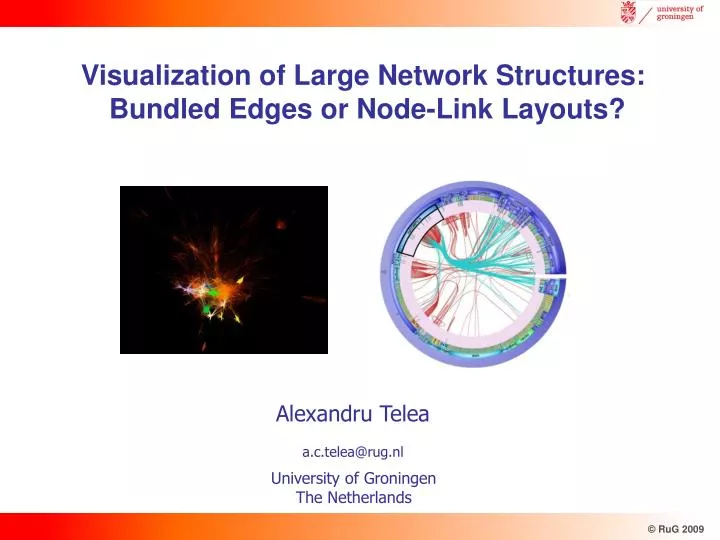
Visualization of Large Network Structures: Bundled Edges or Node-Link Layouts?. Alexandru Telea a.c.telea@rug.nl. University of Groningen The Netherlands. Problem. How to visually understand a large network?. visualization method. answers / insight. large attributed graph. users,

E N D
Visualization of Large Network Structures: Bundled Edges or Node-Link Layouts? Alexandru Telea a.c.telea@rug.nl University of Groningen The Netherlands
Problem How to visually understand a large network? visualization method answers / insight large attributed graph users, task, questions • so many methods, so hard to choose • ‘best method’ combines • familiarity and intuitiveness for users • availability • simplicity of use • scalability and level-of-detail • capability to show both structure and attributes
User study Compare a well-known classic with a strong newcomer! 1. Node-link diagrams • familiar to virtually all users • dozens of layouts (force-directed, hierarchical, trees, radial, …) • availability: Tulip framework [Auber et al, 03] – scalable to >1M nodes/edges 2. Hierarchical edge bundles • recent, very well received [InfoVis ‘06 best paper award] • presented technique immediately appealing… • …but is it better than node-link diagrams, and why (not), and when (not)? etc…
User study Data, Tasks, Users • graphs: 1000…30K nodes, 2000…350K edges, 1..15 attributes/node or edge • tasks: top-level system decomposition, cluster identification, dependency vs attribute correlation, mutual dependency detection, symmetry detection • users: 12, academy+industry, from problem domain, not viz experts, unrelated to the tool builders (unbiased) • tools: Tulip pre-defined layouts + enhanced version of edge bundle viz • answers: checked & analyzed by domain & tool expert Edge bundle enhancements subpixel node rendering hierarchical edge & attribute aggregation gaps for cross-level edges ‘level lens’ mini table-lens for attribute overviews
Results Edge bundles • clearly preferred when hierarchy & overviews were important in tasks • correlated table lenses provide the needed attribute overviews • unknown to users, but immediately learned • less suitable for structural symmetry detection • unsuitable when position is significant (inherently or due to prior mental maps) Node-link layouts • preferred when position is significant • better for assessing symmetry • better for visually tracing long paths in a context • clearly suboptimal when hierarchy and structure are to be combined • clearly less scalable visually/computationally (even in the highly optimized Tulip) Open questions • can we add position semantics to nodes/edges in the bundled edges? • how about a multilevel bundled edges layout using more concentric rings / edge layers? • how to add symmetry reflection in the bundled edges layout? • is the more recent node-link edge bundling [Holten et al, 09] indeed as effective? • how to show time dynamics in the bundled edges layout?