Download

1 / 27
280 likes | 387 Vues
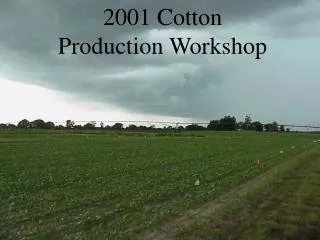
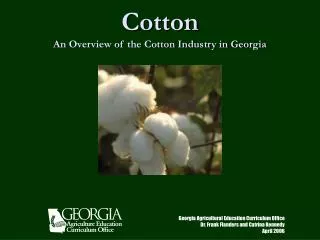
Simulation Analysis and Economic Impact of Georgia Cotton Production. Archie Flanders Center for Agribusiness and Economic Development University of Georgia. Production Background. Cotton is largest field crop in Georgia in terms of acreage and revenue.

E N D
Simulation Analysis and Economic Impact of Georgia Cotton Production Archie Flanders Center for Agribusiness and Economic Development University of Georgia
Production Background • Cotton is largest field crop in Georgia in terms of acreage and revenue. • 1.4 million acres were planted in 2006. • Cotton is an important rotation crop with other crops, especially peanuts.
Financial Background • Cotton has high variable costs per acre. • Expensive harvesting equipment leads to high fixed costs. • FAPRI data indicate that US cotton production derives 20% to 30% of revenue from government payments.
Georgia Rural Economies • Many rural economies are dependent on agriculture. • Georgia derives 8.6% of economy from agricultural production and directly related manufacturing. • Many GA rural counties derive over 50% of economy from agricultural production and directly related manufacturing.
Economic Development • High costs to cotton industry represent economic activity to other industrial sectors. • DP, CCP, and LDP are utilized for input purchases. • Government payments flow into industrial sectors outside of agriculture.
Methodology • Industry simulation model (Net Returns) • Input-output model (Economic Impact)
Industry Simulation • Average production unit is 700 acres. • Model costs derived from UGA crop enterprise budgets and NASS. • Georgia yields and prices are from NASS aggregate data.
Simulation Model • NR = Revenue - VC – FC • Revenue = (Price * Yield * 700 acres) + DP +CCP + LDP • DP & CCP (GA base yield (FSA), 700 acres) • VC = 2006 Baseline (Harvesting costs change with yield)
Costs Data • VC = $429 per acre - (sell seed to gin) = $390 per acre • Fixed costs are $70,687 for 700 acres. • Costs are industry average, weighted for irrigated : nonirrigated acreages and cotton seed technologies.
Average GA Yield and Price Data • NASS yield 2001 : 2006 (Dec. estimate) 726 lbs./acre • FAPRI US price for 2007-2011 is above $0.53/lb. • Current simulation applies $0.529/lb. (10 year GA average) • AWP: 2002-2005 averages $0.048 less than GA market price (Average = $0.481).
Stochastic Simulation Covariance: Normal Distribution in Simetar
Average of 500 Iterations $26,624 NR to land & unpaid labor $99,014 GP GP is 25.0% of revenue (Market lint & seed sold + GP)
Distribution of GP • 27% goes to farmers and landlords. • 73% goes to input suppliers. Examples: Seed, chemicals, fertilizer, equipment manufacturers and dealers, fuel, electricity, and labor.
Economic Impact: Input-Output Model • Itemized cotton industry direct costs are entered into 18 US industrial sectors. IMPLAN (software) • Farm expenditures are direct impacts. • Direct impacts lead to indirect impacts (businesses purchasing from businesses and employees spending income).
Labor Income is Wealth Created $72,390 (GP-NR) of industry average $99,014 GP leads to $282,100 in labor income to employees and proprietors in US economy. (3.9 Multiple) This does not include income to farmers and landlords.
Compare GP to Taxes Generated $99,014 GP to industry average farm $108,763 Taxes generated by farm $9,749 more taxes generated than received For each tax dollar that the GA cotton industry receives in GP, it generates $1.10 in tax revenues for federal, state, and local governments in the U.S.
US Federalist System • Each level of government does what is most appropriate for it to undertake. • Federal government is best suited to sponsor programs for US agricultural commodities. • 58% of taxes generated go back to federal government as new tax revenue. • Remaining 42% goes to state and local treasuries to apply for programs best undertaken by these levels of government.
GA Cotton Industry without GP • Average NR with GP is $26,624 • Average NR without GP is -$72,390
Summary • 73% of GP goes to input suppliers, 23% goes to farmers and landlords. • Each dollar received by GA cotton industry as GP leads to $1.10 in tax revenue.
Conclusion • GA cotton industry is not financially viable without GP. • Economic impacts throughout US economy would be lost without GP. • Rural economies have few alternatives to agriculture.