Download
1 / 19
190 likes | 335 Vues
Source-Receptor and Exposure Studies using CRUISER. Air quality research related to the Border Air Quality Strategy Great Lakes Pilot GTA SW Ontario Windsor Western Pilot Interior BC Lower Fraser Valley WISE Zone. BAQS Objectives of MSC/AQRB.

E N D
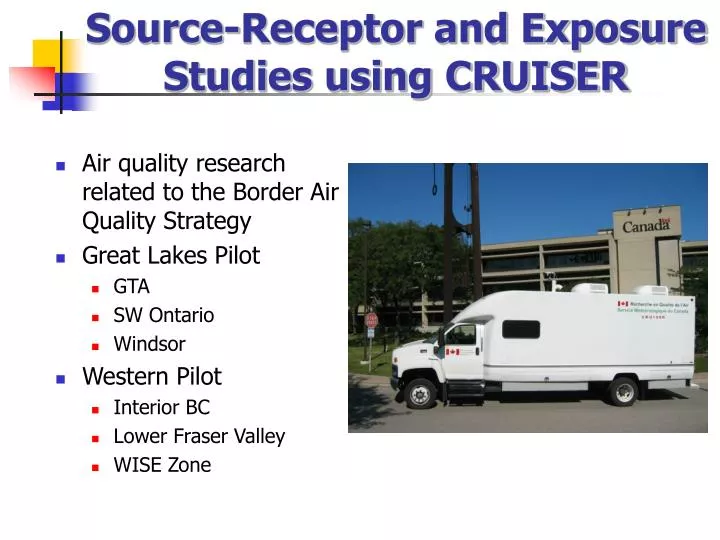
Source-Receptor and Exposure Studies using CRUISER • Air quality research related to the Border Air Quality Strategy • Great Lakes Pilot • GTA • SW Ontario • Windsor • Western Pilot • Interior BC • Lower Fraser Valley • WISE Zone
BAQS Objectives of MSC/AQRB • Linkages between emissions, and fine particle (PM2.5) and ozone (O3) concentrations in the atmosphere and subsequent human exposure levels. • Determination of the emission sources, in both Canada and the U.S., that contribute most to population exposure and environmental impacts. • Quantification of trans-boundary and regional transport and deposition of PM2.5, O3 and their precursors as well as of PM2.5 constituents. • Air quality modeling for investigation of source-receptor relationships, environmental prediction and evaluation of the risks and benefits of air quality management strategies.
Wallaceburg NW: Regional Background SW: Metro Detroit Influence Harrow NNW: Detroit+Windsor Influence other: Regional Background
Specific Measurements Particles AMSAerodyne Aerosol Mass Spectrometer • Composition/sizing info at 5 min data rate or faster • Species of Org, NO3, SO4, NH4 etc from ~0.1 mg/m3 • Aerosols with size ranging 40 nm–1 um TEOMR&P Tapered Elements Oscillation Microbalance • Model 1400ab for PM2.5 • Mass loading data (mg/m3) @ 5 min rolling average CPCTSI Condensation Particle Counter 3010 • Model 3010 counting aerosols 10 nm ->3 um • Continuous data output for 0-10e5 p/cc SMPSGRIMM Scanning Mobility Particle Sizer • Model 5.403 particle counter with one of two classifiers • 5 nm-340 nm or 10 nm-1100 nm with max 250 size bins • Able to handle 0-10e7 p/cc AethalometerMagee Scientific • Model AE-21 with dual channels (UV+VIS) • Black carbon data @ 5 min rate • Sensitivity better than 0.1 mg/m3 Others • TSI Aerodynamic particle sizer • GRIMM optical dust counters for PM2.5 • Laser induced incandescence for BC Mobile Measurements with the • Canadian Regional & Urban Investigation System for Environmental Research Gases and Meteorology PTR-MS Ionicon Proton Transfer Reaction-MS • Analyzing VOCs in the air with 1 hz data rate • Scanning through 30-150 m/z species/fragments • Capable of 1 pptv sensitivity Other gas instrumentsTECO • NOy, modified models 42C and CTL • Carbon Monoxide, modified model 48C Sulfur Dioxide, model 42C TL • Ozone, model 49C Met StationClimatronics • Model TECMAT II sonic met station • Information of WS, WD, T, P, RH with compass • Co-mounted with a radiation sensor • Continuous output through RS232 • Mounted on a motor-driven telescoping tower • At height of ~9.5 m from ground
CRUISER Research Objectives Human exposure: • Detailed characterization of ‘hot-spots’ in order to gain insight into the population’s exposure and into the emissions from selected sources. • Improvement of land-use regression models for quantification of spatial patterns in chronic exposure. Air quality: • Receptor models based upon high time resolution measurements. • Spatial and temporal (4D) characterization and evolution of air masses as they move from urban to rural areas and cross political boundaries. • "Ground-truthing" of satellite observations of air pollutants (e.g., NO2, PM). • In-situ (roadside) measurements of motor vehicle emissions and their dispersion and chemical and physical processes within the spatial scale of model grids. • Tracking of marine vessel emissions (ships) in the Pacific NW and Great Lakes.
Metro Detroit Regional Air Pollutants 2004-05 CRUISER and RASCAL:Rural Measurements (SW ONT) Contribution to Regional background
Airshed & Exposure Characterization Timelines • Fixed sites for PM speciation • Essex - 2003 • Windsor (College&South) - early 2004 • Wallaceburg - Fall 2004 • Harrow - early 2005 (?) • Chronic exposure/saturation monitoring • W, Sp, Su - passive sampling complete in Windsor • W, Su - passive sampling complete in outlying areas • Personal exposure and indoor/outdoor • January 2005 • Summer 2005 • CRUISER & RASCAL • Oct. 2004-Feb. 2005 (1st CRUISE was last week) • 2006 Intensive with multiple universities
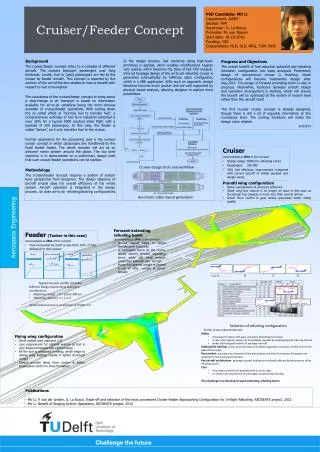
May 11-15, episode. Throughout the time, there was a SW wind.Initially SO4 rose later than Org. Later they tracked each other. NO3 rose at night and disappeared by midday. A sharp rise in SO4 after a clean morning. What is happening? Aerosol Mass SpectrometerData from MSC location
Aerosol Mass SpectrometerData from MSC location Note m/z 44 tends to correlate with SO4 while 43,55,57,69 track organic mass
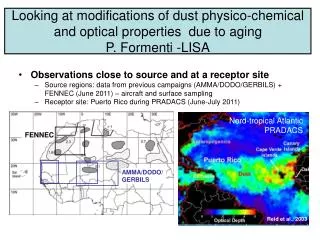
Aerosol Mass SpectrometerData from Resources Rd- 401 study • From August 03-10 • MOE (Resources Rd) and Bay View area • Collect data for the on going exposure study • Investigate how CRUISER instruments suits performing • Compare out PTR-MS to MOE’s TAGA • CRUISER parked along TAGA for a few days and did 4 survey by road • CRUISER did well
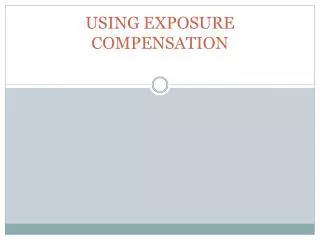
Wind Direction on Aug. 5 D A B C Aerosol Mass SpectrometerData from one road survey at Resources Rd
Gases & BC AMS Particles Upwind Downwind Upwind Downwind VOCs Upwind Downwind Highway Highway Highway August 5th - 'CRUISE'
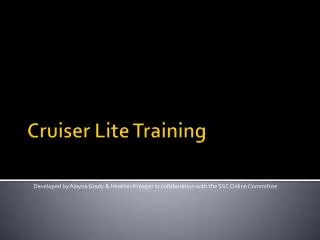
Estimated Exposure to Traffic-Related Air Pollution (nitrogen dioxide) in the GTA KANAROGLOU et al. (2004)
Closing Remarks • New ambient and exposure measurements in SW Ontario, including the MOE sites, will lead to improved understanding of the sources and impacts of air pollutants, as well as opportunities to test and improve models • Comparable measurements in Michigan would be advantageous • Detailed emissions within the airshed are required • Analysis of all the existing and new measurement data presents a challenge all itself and should involve specific model applications • Other funding (e.g., NSERC, CFCAS) needed to ensure/enhance university involvement.
Aerosol Mass SpectrometerData from MSC location Rising of SO4 while Org remain unchanged. Noticed the rise of small size SO4 and later it disappeared. May 17 1300 to 1600
C A D B Aerosol Mass SpectrometerData from one road survey at Resources Rd Details of organic fragments. As expected, the more small size material noticed the closer to highway. Little material noticed up wind from highway