Download
1 / 40
400 likes | 406 Vues
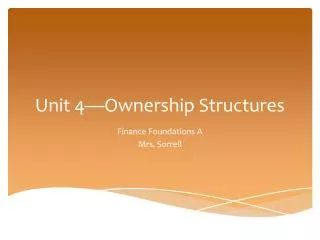
This article explores the use of link analysis to identify indirect and multi-tiered ownership structures in enterprises. It discusses common control, relevant indicators, and highlights the dominance of small enterprise structures. Related research areas and supplemental tables are also provided.

E N D
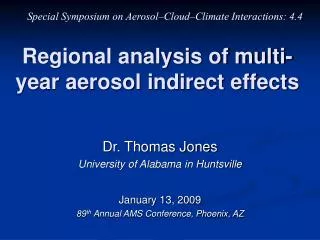
Using link analysis to develop indirect and multi-tiered ownership structures Larry R. May Intelligent Business Solutions Group June, 2012
What is an Enterprise? • Enterprise structures are an attempt to identify all economic activity under the common control of a taxpayer. • Currently limited to flow-trough relationships, parent/subsidiary links, and primary/secondary SSN associations. • Also limited to structures with at least two business returns.
What is common control? • Control is direct and indirect ownership of 50% or more of another entity consistent with the rules set forth in IRC section 267(c) and section 707(b). • Allocation proportions are used as a proxy for ownership percentage. • Other items which may assist in identifying related parties include name similarities, TIN sequencing, common address and common preparer.
Icon Legend High Income High Asset A
Icon Legend High Income High Asset G F B E C D 50% 5% 30% 100% 10% 100% A
Icon Legend High Income High Asset G F B E C D 50% 5% 30% 100% 10% 100% A
Icon Legend High Income High Asset H 100% 20% 20% 50% G F B 15% E C D 50% 5% 30% 100% 10% 100% A
Icon Legend High Income High Asset H 100% 20% 20% 50% G F B 15% E C D 50% 5% 30% 100% 10% 100% A
Icon Legend High Income High Asset D G 20% 20% 5% 15% F H 100% 50% 50% B E C 30% 100% 10% 100% A
Icon Legend High Income High Asset D G 20% 15% 20% 5% 15% F H 100% 50% 50% B E C 30% 100% 10% 100% A
Icon Legend High Income High Asset D G 20% 15% 20% 5% 15% F H 100% 50% 50% B E C 30% 100% 10% 100% A
Icon Legend High Income High Asset D G 30% 20% 15% 20% 5% 15% F H 100% 50% 50% B E C 30% 100% 10% 100% A
Icon Legend High Income High Asset G 30% D 20% 15% 20% 5% 15% F H 100% 50% 50% B E C 30% 100% 10% 100% A
Icon Legend High Income High Asset 33% G J 30% D 20% 15% 20% 5% 15% F H 100% 50% 50% B E C 30% 100% 10% 100% A
Icon Legend High Income High Asset G 30% D 20% 15% 20% 5% 15% F H 100% 50% 50% E C 100% 10% 100% A
Icon Legend High Income High Asset 33% G J 30% D 20% 15% 20% 5% 15% F H 100% 50% 50% B E C 30% 100% 10% 100% A
Icon Legend High Income High Asset 33% G J 30% D 20% 15% 20% 5% 33% 15% F H 100% 50% 50% B E C 30% 100% 10% 100% A
Icon Legend High Income High Asset 15 D 13 A 33% G J 30% D 20% 15% 20% 5% 33% 15% F H 100% 50% 50% B E C 35% 30% 100% 10% 100% 35% L K A Gustufsan Smith Smith
Icon Legend High Income High Asset G 30% D 20% 15% 20% 5% 15% F H 100% 50% 50% E C 100% 10% 100% A
A Simple Enterprise There are 2 other investors (3 in total) in this partnership but this individual has more than 50% ownership This taxpayer has 5 investments but he has a controlling interest in only the 3 shown
One-third (33.68%) of the 1,000,000 enterprises take one of the following six structures 9.74% 6.92% 4.96% 4.57% 3.95% 3.55%
Enterprise Highlights • Over 900,000 are controlled by an individual. • About 50,000 are LB&I controlled. • The Real Estate Industry dominates. • About 20% contained either an initial or final year return. • Usually the same preparer prepared most of the returns. • Enterprises usually have very few investors other than the controlling owner.
Related Areas of Research • Name Similarity analysis • Familial Relationships • Other Heuristics of Relationship and Control • Boundary Refinement (Merging Ent.) • Aggregation methods for data • Risk Assessment • Enterprise Profile • Other…
Thank You for Your Time and Attention Larry R. May larry.r.may@irs.gov
Asset Range by Owner Type Proportion Tiered by Tier Depth
Initial/Final Status by Entity Range Preparer Coverage by Entity Range
Minority Investors by Entity Range Allocation Amount by Entity Range