Download

1 / 22
220 likes | 232 Vues
Applied biostatistics. Francisco Javier Barón López Dpto. Medicina Preventiva Universidad de Málaga – España baron@uma.es. Classical hypothesis tests. Comparing two groups A group receive a treatment. Other group receives placebo treatment. The outcomes are similar?

E N D
Applied biostatistics Francisco Javier Barón López Dpto. Medicina Preventiva Universidad de Málaga – España baron@uma.es
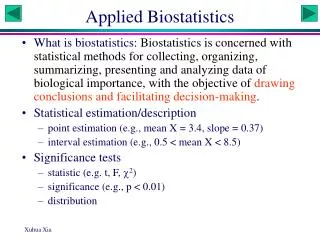
Classical hypothesis tests • Comparing two groups • A group receive a treatment. • Other group receives placebo treatment. • The outcomes are similar? • How is the outcome measured? • Numerically • t-test (student’s t) • Binary outcome: Yes/No, Healthy/Sick, … • chi-squared
Numerical outcome • Problem: • The numerical differences obtained when comparing two treatments are big enough to attribute it to random sampling? • Classiffication: • Independent samples • Paired samples
Paired samples • How: • We have two measurements of the same individual • We have ‘couples’ of similar individuals (matched study)
Paired samples • Null hypothesis: • Mean difference among paired observations is ‘0’ • We reject it when “p” is small (p<0.05) • Two approaches: • Parametric (t-test) • Non parametric (Wilcoxon)
Example: Paired samples • Compare production yield of two types of corn seed. • Type of seed will have influence but others things too: • Sun, wind, cropland… • Idea: Let’s test the two types of seed in the same conditions
Independent samples • Research question: • Calcium intake lowers blood pressure? • Material and methods: • Two samples of individuals (independent) • Experimental (calcium intake)/Placebo • There must be some difference among means, Can they be explained by random chance? • We choose a statistical test and compute significance (p). • When p is small (p<0,05) we have evidence for differences not random: Calcium intake have a signifficant effect on blood pressure.
Independent samples • Null hypothesis: • There are no difference among groups • Two ways of computing signifficance • Parametric (T- Student) • Non parametric (Wilcoxon, Mann-Whitney)
Example: Independent samples • We think that calcium intake decreases blood pressure. To test it, we use two groups of similar people to do an experiment: • Experimental group: 10 individuals, 3 months of treatment. We measure the difference (change in blood pressure) • “Before” – “After” • Control group: 11 individuals, placebo for 3 months.
Validity conditions: t-test • Similar dispersion: homoskedastics. • Normality: • Kolmogorov-Smirnov
Numerical variable compared in 3+ groups • Research question: • When comparing means if 3+groups, can we attribute the differences JUST to hazard? • Generalizes t-test. • Numerical variable that measures outcome is called: dependent • Numerical • Variable that classifies individuals in groups: factor • Qualitative
3+ independent samples • Null hypothesis: • There are no differences among the groups • Two ways of computing signifficance: • Parametric: One-way ANOVA • Non parametric: Kruskal-Wallis.
Example: 3+ independent samples • Experiment to compare 3 reading methods • Random assignment • 22 students in each group • We measure several variables, “before” and “after” (pre-test/post test). The outcome is the difference (numerical variable)
Design problems? • Do they had the same value “before”? • No evidence against (p=0,436)
Validity conditions for ANOVA • Similar variability: Levene’s test (we want p>>0,05) • Normality in each sample (p>0,05) • Conditions can be violated if sample sizes are big.
And now the interesing part • Are the differences significant?
A posteriori-analysis • Planned comparisons • You need to justify them a priori. • Post-hoc comparisons